


AAPL, GLBE at critical support


Two companies appeared on our trend finder for critical support levels.
Apple (AAPL)
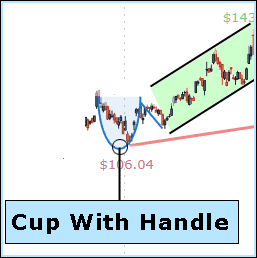
For our fist image, we share a daily stock chart of Apple Inc (AAPL) over the last 3-years with Pattern Finder’s automatic markings.

Pattern Finder identifies a bullish pattern known as “cup with handle” followed shortly after by another bullish pattern known as an “ascending base.”

With the click of a button, Pattern Finder then adds an algorithmically drawn support line.
Here is the full-size image again for reference, and this time note the red support line:

This support line begins at the low of the cup with handle and connects it to the bottom of the ascending base in order to create the basis for the line. That line hits about $154 for AAPL as of Friday’s close.
As AAPL moves forward, traders may view this support line as a technical decision point: support for a swing trade which must be held for the stock to rise, or an exit for a swing trade should the stock dip below the line.
Global-e Online (GLBE)

1. We see cup and a lower low; which is a failed bullish attempt ending at $66.78.
2. Next, a downtrend where the stock dipped all the way below the 50-day moving average, then rose above it with the July rally.
3. Finally, a failed rally with a small double top at $37.65.
The stock is now above the 50-day SMA but below 200-day SMA and right on our algorithmically drawn support.
These are just a couple of the many use cases and patterns developed by Capital Market Laboratories (CML) Pattern Finder.
We will continue to share charts with short discussions over the next few weeks before the product becomes available.
If you want to be an early user and get all the updates, you can do so going to our early product alerts page.
You can sub to this newsletter below:
this service looks very promising, especially the cost for this service!