


Banks Stoke Contagion Fears; Tech Shows (Some) Strength

Lede
In our Daily Economics post today we wrote ‘Daily Economics - Producer Inflation Stuns Lower; Retail Sales Fall, Yields Fall, Another Bank Problem.’
Yields plummeted, oil plummeted, VIX spiked, but… tech rallied.
It’s time to look at some bullish tech charts; and one outside of tech.
Bullish (Tech) Charts
We’re looking for a chart set-up such that we have the following:
An up trend
More room to nearest resistance than nearest support as computed by PnL zones.
Off we go.
We start with the “Bullish Charts; 3-yr Charts; Nearest Congestion or Trend” screen, allowing Pattern Finder to draw in congestion lines (pink), trend support (red), trend resistance (green), CANSLIM patterns, and finally profit and loss zones.
We started with a rather nondescript chart for ticker VERX:

Then we enabled Pattern Finder’s algorithms (we ‘pushed a button’). Here’s the same chart, now marked up by Pattern Finder:

We see distance to the next upside congestion at 12.1% and distance to the next downside target at -4.6%. That yields a larger reward:risk, and combined with an uptrend has the odds slightly stacked on a bullish traders favor.
We zoom in for clarity:

We then turned back to OKTA, a tech stock that rose off of earnings, is in the security space which as proven to be far more resilient to macro headwinds than general DevOps, and qualifies for the bullish requirements we set out above.
Here is the 5-year chart. Note the recent uptrend, a gap fill, and a profit zone larger than the loss zone.

But it’s the 3-year and 18-month charts that we are more focused on for shorter term stock movement. Here is the 3-year chart and we note the size difference between the next upside target and the next downside target as drawn by Pattern Finder:

Let’s zoom in for clarity but let Pattern Finder add the 50-day simple moving average on the chart in the green line:
The stops on this chart would be tight; less than 9% to the downside. The profit zone extends to the next congestion line which is more than 30% higher.
The 50-day simple moving average coincides with the nearest congestion line to the downside (it’s magic!), yielding a confirming stop zone for a short-term stock move.
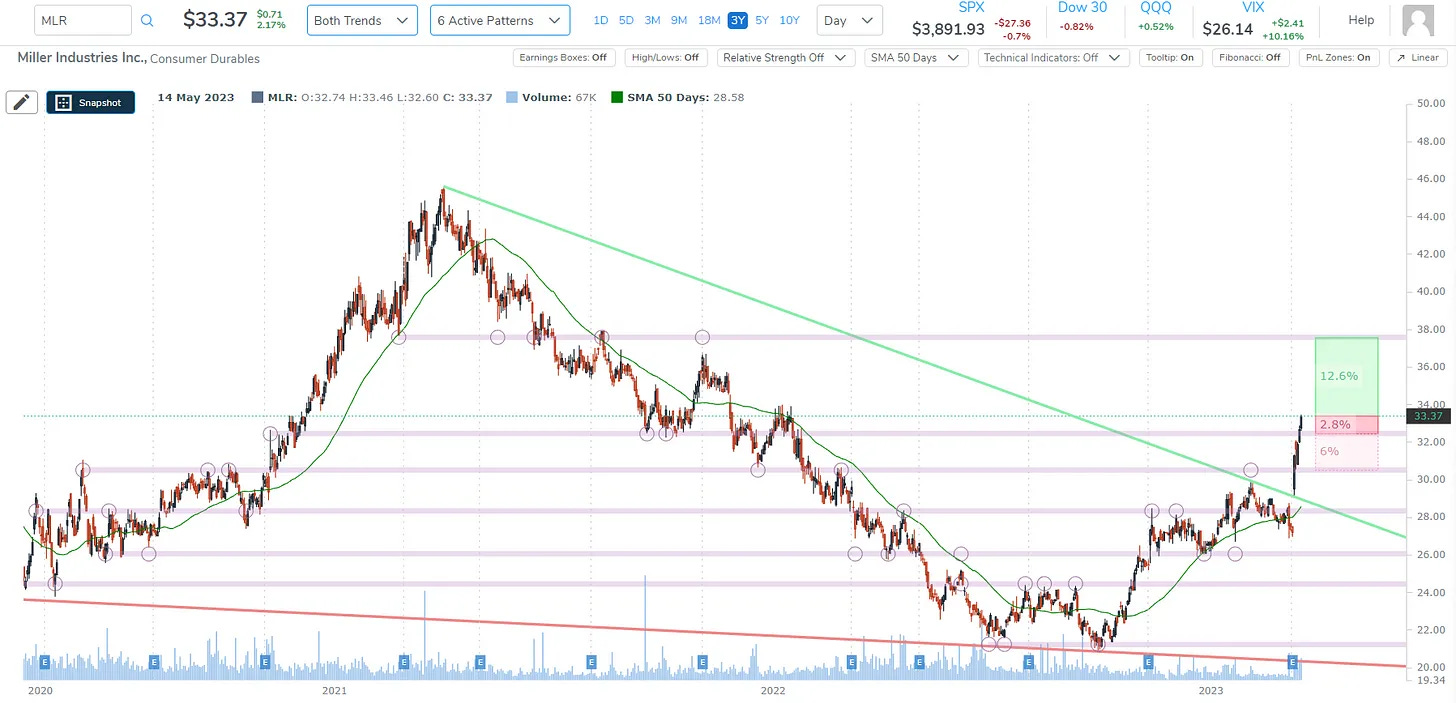
Since we’re on the subject of bullish charts, we feel compelled to reach outside of tech and look a consumer durable stock, MLR (Miller industries). This stock came up on the same screen that brought us VERX.
Here is the 3-year chart; the uptrend is rather obvious:
The news driving this stock is easy to find on Pattern Finder. We just went to the ticker news tab to the right of the chart:

And the first two stories tell the tale:
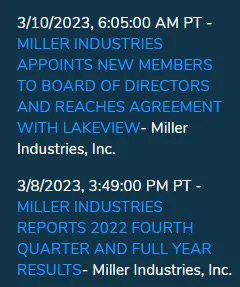
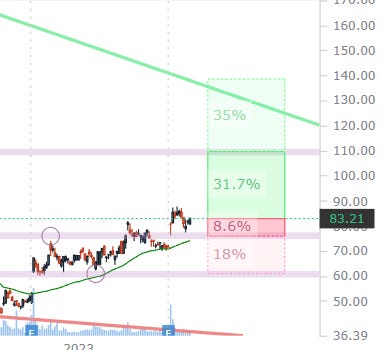
Earnings and an agreement with Lakeview for board members. Let’s zoom into that chart we presented above:

The word of caution we have here is the possibility of an overbought stock with RSI spiking to nearly 74 (70 is considered overbought). A great chart for the watchlist!
Alright, that’s it for today.
Conclusion
Macro will run the market for the foreseeable future, but then it will come down to stock by stock selection.
I’m asked often about the charts: “is this all done automatically, or are you marking up the charts?’
I assure you this is simply entering a ticker, clicking the settings on, and off Pattern Finder goes.
We are offering a huge discount, which is on the page below as well as member feedback and a great 7-minute video demo: Pattern Finder: The Next Era of Charting
Thanks for reading.