


Beating the NASDAQ 100 with Tail Analysis, Return Asymmetry, and Bullish Set-ups

Lede
We have scheduled a release date to TradeMachine and Pattern Finder for our new AI capabilities and new backtesting data driven by it; namely kurtosis and skew ratios.
You can register for the webinar here
Turning AI, ChatGPT, and LLMs into Profits
Now we turn to examples of the new capabilities.
Preface
Today we will look at two more stocks that start with bullish charts on the one-hand, and then have positive distributions of return characteristics as measured by tail risk (kurtosis) and distribution skew (a measure of the asymmetry of return distributions).
But, we go further again, by now extending the analysis to compare our tech stocks to the NASDAQ 100 (QQQ), rather than the S&P 500.
Definitions
Tail Risk: The risk of an extreme event occurring that could drastically change the value of a portfolio or investment.
Kurtosis: A statistical measure that essentially measures the "tailedness" of the probability distribution of a real-valued random variable.
Tail analysis is backward looking.
Skew: In the context of stock performance, skewness or skew refers to the measure of the asymmetry of the probability distribution of a real-valued random variable about its mean.
There are two types of skewness - positive skewness and negative skewness.
Positive skewness: In the context of a stock's returns, this means that the stock has relatively frequent large gains.
Negative skewness: In the context of a stock's returns, this means that the stock has relatively frequent large losses.
Skew is also a backward looking analysis.
Together, kurtosis and skew give us an view of a stock’s return distribution characteristics, especially when we compare the returns of a stock to the market (S&P 500), or what we do today, which is compare it to the NASDAQ 100 (QQQ).
Bullish Charts With Opportunistic Tail and Skew
We start with bullish charts and that is a rather complex tasks if not for Pattern Finder and the bu9ilt in charting algorithms.
Even better, rather than search for tickers, we’ll just turn to the screener inside Pattern Finder a focus on “Directional Charts” screens, like this:

We pluck out a tech stock ESTC.
If a stock shows up on this screen, we already know what we will find:
Uptrend.
Larger distance to next upside target than downside target as measured by the green and red shaded zones.
Here is the 3-year ESTC chart and we zoom in on the recent portion to focus on the that target zone differential.

ESTC has risen off of a double bottom and then a cup and handle, which are automatically identified by Pattern Finder, and now has the start of a move above the closest congestion line (pink line).
There is no magical way to tell if the stock will hold that move, but what we can do is lean on probabilities and that’s where we make us of the bullish chart.
OK, that was step 1: Bullish Chart.
The next step is to compare ESTC to the QQQ, and that is done with our free finance driven integration with Chat-GPT and several other algorithmic layers.
We make a simple request:

And we get quite advanced results.
First, we turn to the one-year comparison and we focus on the distribution of comparative daily returns, namely:
Outperformance kurtosis vs underperformance kurtosis (tail analysis).
Absolute value of upside skew vs downside skew (asymmetry of returns).
For ESTC, both hit the mark, with upside tail movements (kurtosis) and asymmetry (skew) leaning to outperformance.

That simple prompt also kicks off one of our other statistical layers and prints a chart of daily return comparisons of ESTC vs QQQ:

What is absolutely fascinating here is that ESTC unperformed QQQ in the last year, and how little it matters to us when trading options:
Here are the stock returns (from that same table above):

Using AI driven by finance domain expertise and layered with financially relevant stats cares zero about that number in isolation - we want the tails and asymmetry of the distribution.
Here are the results of selling a weekly out of the money put spread in ESTC with a simple rule - always skip earnings. That is, the window two days before earnings to two days after earnings has no trades.
Doing this in TradeMachine is a triviality, as in, enter a ticker and click three buttons:
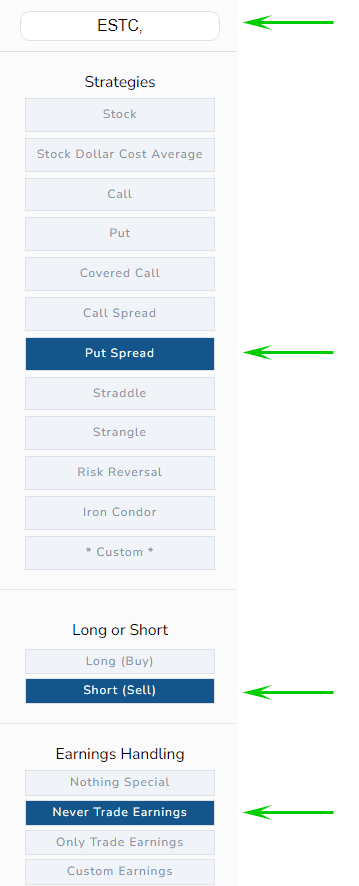
And here are the results over the last year:

So, the rest of finance can look at stocks and judge them on the rather simplistic view of stock returns versus the index.
We prefer the slightly different version:
Find bullish charts driven by Pattern Finder’s algorithms.
Find positive tail behavior.
Find positive asymmetry of returns (skew) behavior.
Backtest.
Let’s follow that exact same process for another stock that sowed up on the same screen in Pattern Finder: DDOG
Here is the 3-year chart, and again we zoom in on the recent portion and call it out.
We just wrote about DDOG in the prior post and how these results were excellent, even though the stock was sort of “stuck.”
We wrote this:
A stuck stock price can actually be quite a nice find for an option trader, as long as the volatility characteristics appear to be favorable (it’s probabilities, not a sure thing - not a magic bullet).
The probabilities worked in the bullish favor Friday, with DDOG rising 4%.

We then turn to the same prompt as we used above:

And the same statistical package was kicked off in our AI.
We see larger upside tail moves (kurtosis) than downside, and an asymmetry in the daily return comparison to the upside (upside skew).

And… here is the same backtest:

We hope that it’s becoming apparent what TradeMachine and Pattern Finder are, but also, what they will be.
These AI prompts we offer for free today may or may not remain free, but they will definitely be inside of both Pattern Finder and TradeMachine, with two major differences than what you see now:
Far more advanced capabilities.
Results inside screens and scans so you don’t have to go stock by stock - you can just search for the largest tail and skew results.
Alright, that’s it for Saturday’s quick post.
This is not a trade recommendation at all. We wish it was just this easy. It isn’t - but it’s getting there.
We are demonstrating how important tail and skew characteristics can be when trading stock and options (and few people use them).
Conclusion
We hope this was instructive and thank you for reading.
Pattern Finder and TradeMachine are about to get massive upgrades - right on schedule - right as we said - about three to four weeks from today.
A scannable and more advanced version of this analysis, and a lot more, is coming.
If you’re not an option trader, then Pattern Finder will be your powerhouse.
If you are an option trader, then TradeMachine will be your powerhouse.
And if you want both, we offer Pattern Finder to TradeMachine members for just $11 / mo.
The products are going to improve - slowly, and then all at once.
The prices are going to go up too.
But the price for members that join before we integrate our vast libraries of AI over the coming weeks, months, and years, that are in development, like this tail analysis report turned into scannable data, will not go up.
Learn about Pattern Finder here.
Learn about TradeMachine here.
Thanks for reading, friends.
Legal
The information contained on this site is provided for general informational purposes, as a convenience to the readers. The materials are not a substitute for obtaining professional advice from a qualified person, firm or corporation. Consult the appropriate professional advisor for more complete and current information. Capital Market Laboratories (“The Company”) does not engage in rendering any legal or professional services by placing these general informational materials on this website.
The Company specifically disclaims any liability, whether based in contract, tort, strict liability or otherwise, for any direct, indirect, incidental, consequential, or special damages arising out of or in any way connected with access to or use of the site, even if we have been advised of the possibility of such damages, including liability in connection with mistakes or omissions in, or delays in transmission of, information to or from the user, interruptions in telecommunications connections to the site or viruses.
The Company make no representations or warranties about the accuracy or completeness of the information contained on this website. Any links provided to other server sites are offered as a matter of convenience and in no way are meant to imply that The Company endorses, sponsors, promotes or is affiliated with the owners of or participants in those sites, or endorse any information contained on those sites, unless expressly stated.
Is Pattern Finder ready for ME to ask to compare a stock with QQQ? If so, where do I find the box to type that request? Thanks for an amazing adventure in statistical and probability research that you do so well!