


Breaking the Mold - New Capability Identifies Chart Set-ups by for Short- and Long-term Traders


Lede
Today we extend our capabilities for finding bullish and bearish charts by allowing access to more of our proprietary chart drawing algorithms.
This will lead us to both short-term swing trade set-ups for consideration (measured in weeks) as well as longer-term setups (measured in months).
Bullish Longer-term Charts - New Algorithm Exposed
For this set of bullish charts, rather than focus on our congestion lines exclusively, we will instead focus on our trending support and resistance lines.
Trend support and resistance are generated through longer term price evolution, so naturally it should lead to longer-term set-ups.
We start with a new screen:

The newly exposed functionality for Pattern Finder members is access to trend resistance and trend support (the bottom of the screen).
We want more upside potential (distance to resistance) than downside risk (distance to support), but in this screen we are not screening on the intermediate points of support and resistance (congestion lines).
We get one ticker, APG, and we start with the 3-year chart.
We let Pattern Finder draw in those trend support (red) and trend resistance (green) lines, and also include the 50-day simple moving average (for you technicians!). Finally, we include the CANSLIM patterns.
(As a “by the way,” we have enabled text writing on the charts under the drawing tools in the upper left hand side of the chart so you can label what we refer to on the charts now.)

Before we zoom in, let’s take note that this stock has seen a series of higher lows and higher highs, which creates an uptrend in both trend support and trend resistance. This has created an up swinging 50-day moving average (dark green line).
Now we zoom in to discuss profit and loss zones. We add a horizontal line to denote the all-time high as the recent peak:

In general, we would expect using trend support and resistance, rather than congestion lines, as longer-term trades to reach profit or loss zones.
Alright, that’s using trend support and resistance on the 3-year chart with a nice set-up to analyze.
The best news is that this entire functionality, with mark-ups, is coming to Pattern Finder with the click of a button.
Yep, pick a chart, click a button, have profit and loss zones automatically drawn in for you.
Now we do the same but using an 18-month chart; so the same screen but using a different time frame and end up with ticker RCM:
We have annotated the chart for the ascending base and cup as well as the trend support and resistance lines, and again satisfy our technicians with the 50-day SMA:

We can see that the distance to trend support (red line) is smaller than the distance to trend resistance (green line), and the 50-day SMA could act as a tighter stop for a loss zone.
Let’s zoom in and mark up the zones:

And, this time we can add the congestion lines (pink lines) for some intermediate targets as well:

There you have it.
Now let’s turn back to shorter time frame trade set-ups by using congestion lines as support and resistance.
Bullish Short-term Charts - Congestion Lines
We have covered this usage in the prior posts here, but we also made a 2 min 58 second video to demonstrate how to do this in Pattern Finder.
Here’s the video, and then we’ll do a chart:
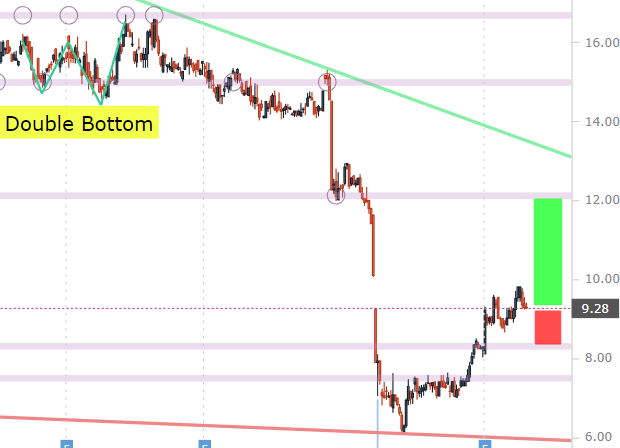
And, a screen result we get PVBC, a small cap finance company.
We annotate the CANSLIM patterns, in this case an ascending base, a cup, and a double bottom.
We also shade in the profit and loss zones using congestion lines (pink lines), which are tighter than the trending support (red) and trending resistance (green) lines, and thus are shorter-term setups.

Finally, we can zoom in to the chart.
We note that the nearest upside congestion would be a gap fill, and nearest downside congestion is a rather tight stop to the end of the gap.
Conclusion
This was just a taste of Pattern Finder’s capability. Soon, Pattern Finder members will get these set-ups in daily emails, and there will be a “click of a button” to mark up charts.
We invite you to discover the benefits of Pattern Finder for yourself by visiting the page below, and before the price hikes after we add substantial capabilities: Learn about Pattern Finder