


Breakouts, Buy Rating Strength, Sell Rating Strength

Lede
Today we delve into one of the four proprietary ratings built into Pattern Finder: the ‘Buy Sell Rating.’
Ratings, Screens, Stocks
The ‘Buy Sell Rating’ from Pattern Finder is defined as such:
Our proprietary rating for identifying buying and selling activity in a stock over the last 50-days. We use a proprietary formula which puts heavier weight on the shorter-term, to create a rank system where stocks that have heavy buy to sell volume, strong RS, and strong stock returns get a high rating and stocks with high sell to buy volume, weak RS, and weak stock returns get a low rating.
A score of 100 indicates the strongest buying activity and a score of 1 indicates the strongest selling activity.
Today we created three screens with the Buy Sell Rating. Here is the first:

We looked at stocks in the upper tier of the Buy Sell Rating with minimum revenue and market cap requirements, and then only those with positive returns for the last 1-week, YTD, and 1-year.
Out of nearly 10,000 companies, we are left with one. We actually shared this stock yesterday with our few beta testers :-).
Here is the chart for CCRN:

The support line (red) was drawn automatically by Pattern Finder, but in truth the 50-day SMA (the blue line) does appear to act as tighter support.
We drew in the horizontal resistance line, starting at the high in Dec 2021 and letting it hit the similar highs in 2022:

The stock has blown through resistance and is at all time highs on rising volume, pictured below:

For a swing trader looking to ride the momentum, a natural stop could be that prior resistance and the profit zone could be the Fibonacci extension.
Screens 2 and 3
We didn’t want to limit ourselves quite that much in two other screens where we made use of the Buy Sell Rating, and as usual, we looked at both strength and weakness.
First, buying strength with a new screen just for Technology:

We were left with 16 companies, you can feel free to peruse these names:

We pluck two of the names out simply to look at some charts.
First, FROG:

This stock made a series of lower lows and lower highs over the last 18-months, but has now made a higher high as of today. But, it’s smack on the down trending resistance (green line) as drawn by Pattern Finder.
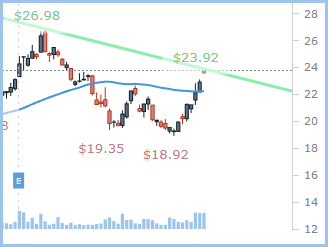
A long swing trader that sees recent market strength in general as continuing has a natural profit zone limit of ~$27 from that prior high, and a stop at the 50-daySMA.
Another nice chart from the scan can be seen in ticker MODN:

Pattern Finder draws its trending resistance (green line) through the prior peaks in 2021. The trampoline affect came from support if drawn from the recent lows.
I drew in the trend support myself:

A long swing in MODN would be rather bold given its recent trajectory, but it’s a cool chart nonetheless.
Of course, the recent rally in the market could be nothing more than a mirage, so we did the same scan, but this time looking for weakness, even in a two day bounce:

And here are those results:

We’ll leave the chart work to you on these, but pair trading now could still be opportunistic.
What’s Next
We will continue to share charts, screens, and short discussions over the next few weeks before the CML Pattern Finder product becomes available in late October.
The product will have everything IBD MarketSmith® has, a lot more, like algorithmically drawn support and resistance trend lines, built with better, faster, more flexible, and more responsive technology.
It allows for additional technical signals beyond just those offered by the CANSLIM methodology, far richer fundamental screening data, but…
… it will cost 70% less. Yes, 70% less.
Stay tuned to this channel.
Thanks for reading CML Pattern Finder.