


Breakouts from Resistance and Double Bottoms Emerge - Chartist Wonderland


Lede
In prior posts we satisfied our technical analysts, fundamental analysts, as well as our volume, RS, and buying strength seekers.
Today we satisfy our chartists with the newest feature that will be released to Pattern Finder this week (by Friday).
Chartists - Patterns and Breakouts
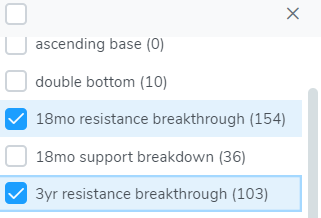
As of this week, the ‘Pattern Breakouts’ portion of Pattern Finder will be released into general availability:

And we have a lot to choose from to continually drive the idea generation portion of the platform.
We have said full throated that we believe the screener in Pattern Finder is the most powerful real time idea generator in the world, and we now say the same for the pattern breakouts engine.
Let us start with breakouts from resistance and we’ll be focused — looking for stocks that are breaking out of both 18-month and 3-year resistance.
First up on the list (alphabetically) is Alcoa (NYSE:AA):

Next, we display both time frames, and enable Pattern Finder to draw in not just the trending support and resistance, but also the congestion lines and CANSLIM patterns.

In the 18-month chart we see the breakout above resistance right to a congestion line:

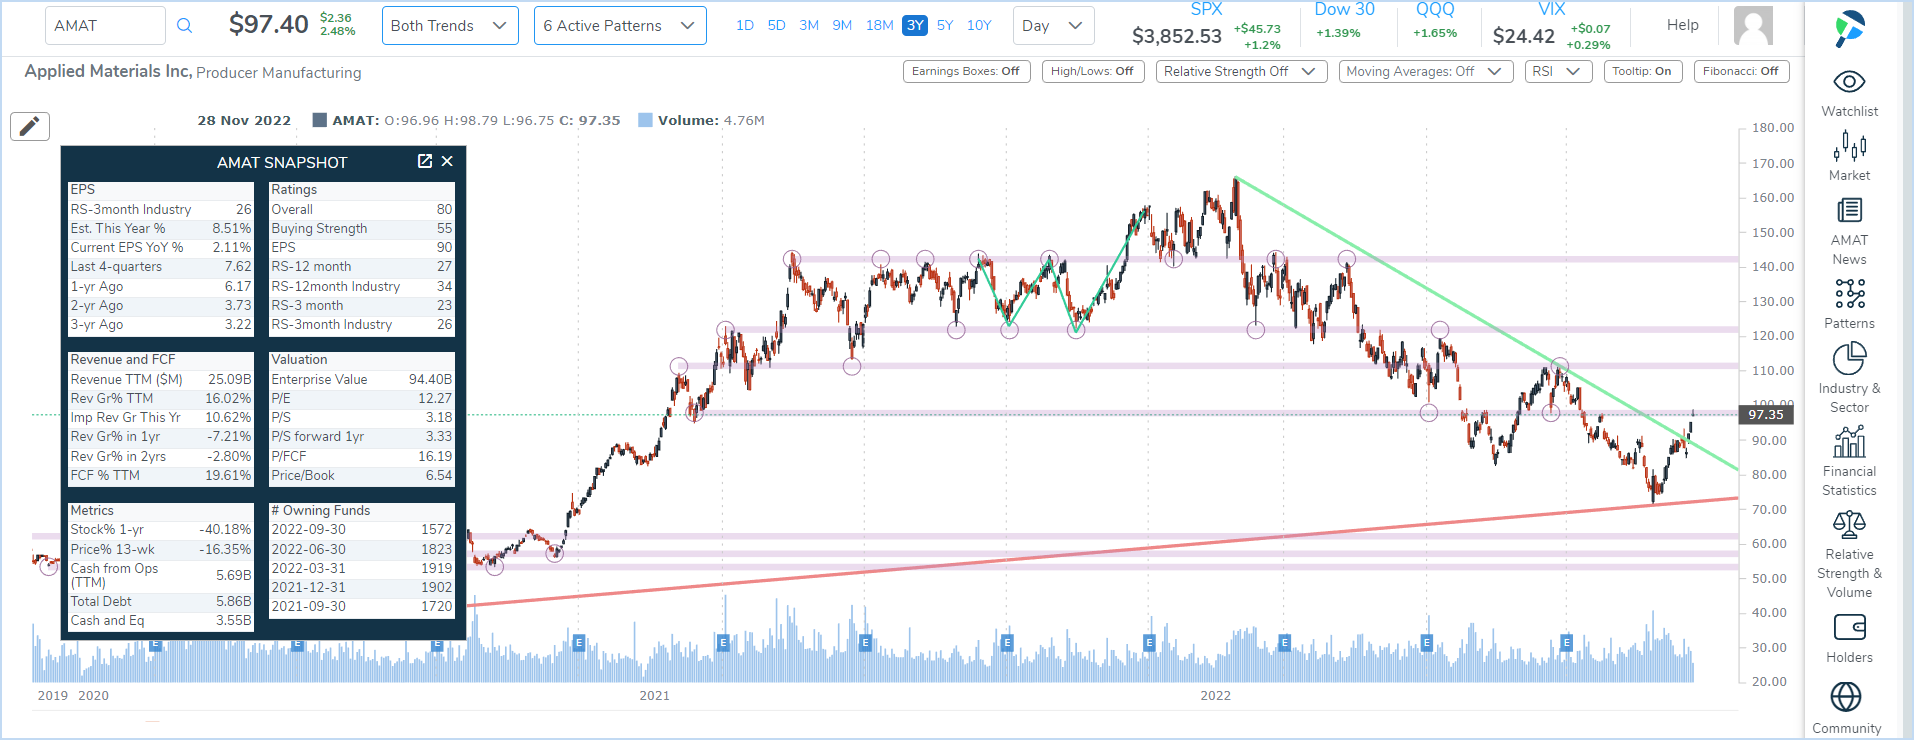
Next, we turn to the 3-year chart:

The short-term (18-mos) and medium-term (3-yr) charts are in harmony. The same breakout from resistance and right on congestion for each time frame.
Next, to complete our systematic approach to charting (as seen in the 5-minute video How to use Stock Charts in 5 Minutes), we turn to a long-term chart.

With RSI at well contained (53), the conclusion we see is best expressed as a trading plan on a chart we presented in the video How to use Stock Charts in 5 Minutes.
AA is at a congestion point, a thrust higher on volume makes this a rather pretty chart with well-defined profit and loss zones (start with loss zones — it’s good psychology).
We now do the same process for another stock that satisfies the breakthrough multi-period resistance: Applied Materials (NASDAQ:AMAT):
And then the 18-month chart:
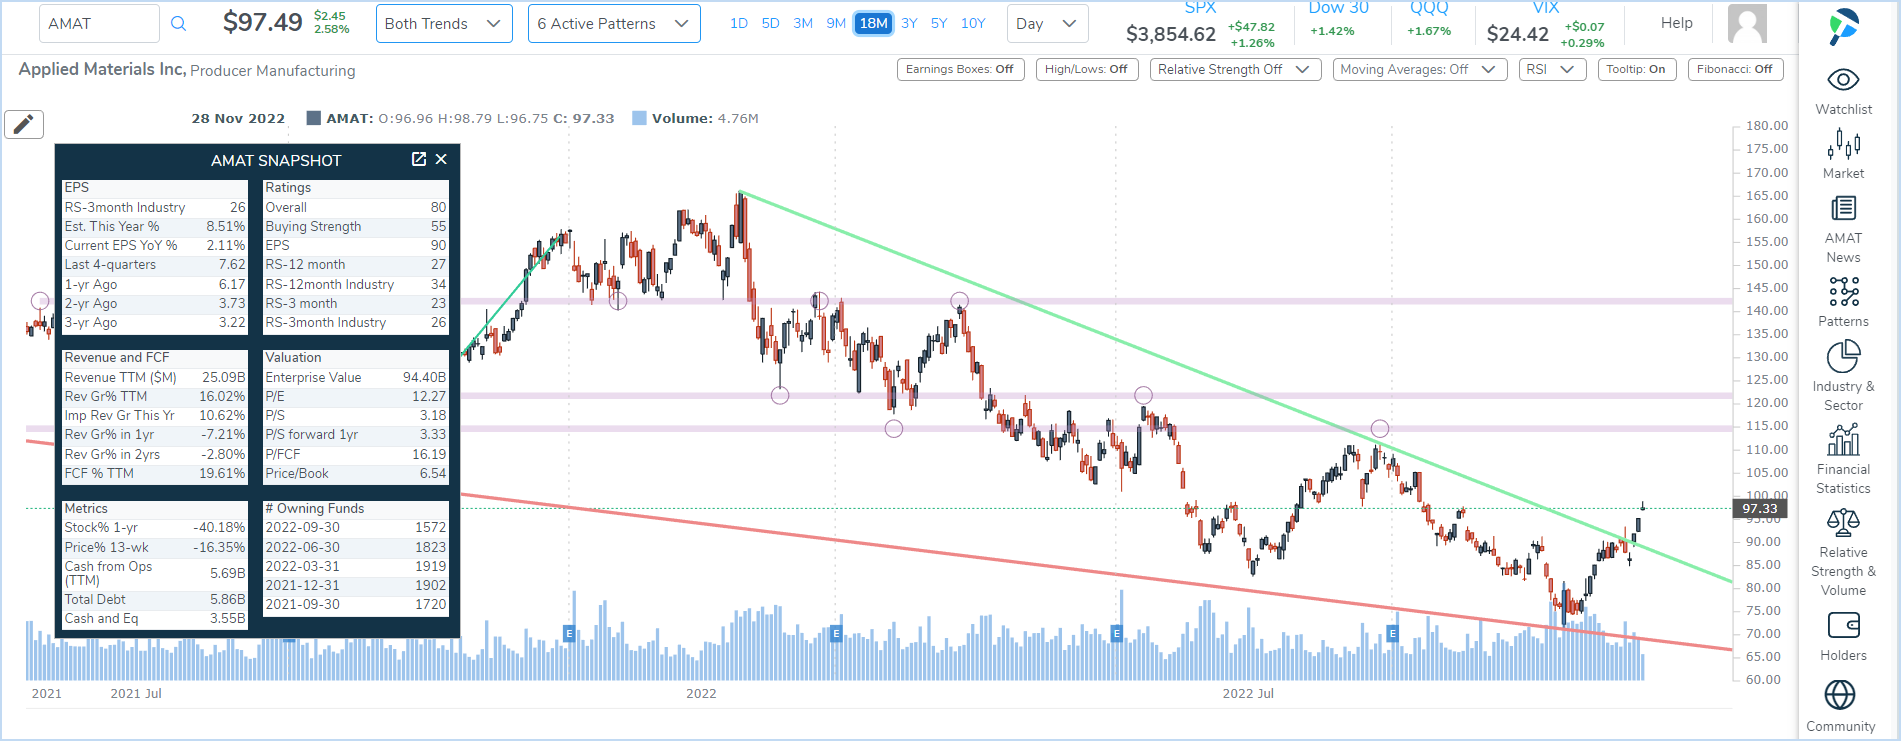
The short-term chart looks nice, but we have to caveat everything here with the fact that today is (1) election day, and (2) CPI and Core CPI data will come out Thursday before the market opens, so.. traders be… mindful!
Again, for the final part of charting, which is to actually turn a chart into a proper trading plan, please revisit the 5-minute video presented above.
More, More, More ! Chartists - Patterns and Breakouts
OK, OK, we won’t just choose the first two stocks in alphabetical order… we’ll share some more names for you, traders, to peruse, this time using pattern breakouts to identify double bottoms.
We see some recent double bottoms, which usually means a resistance point but can also mean… a breakout. We show both:
Here is a three-year (daily) chart of NVO (NYSE:Novo Nordisk) - it has completed its double bottom, is at congestion, and a reinforced resistance point from a cup formed a few months earlier.

Next, we can turn to a bank with a recent double bottom, but this time with room to rise: Bank OZK (NASDAQ:OZK).

We zoom into the recent time frame and draw some hypothetical profit and loss zones.

Alright, that’ll do for now, chartists!
Conclusion
Patten Finder is a charting and technical platform with robust screening for fundamentals, growth, RS, buying intensity, volume, and a much more (including all of the CANSLIM patterns, like cups, cups with handles, ascending bases, and the rest).
You can learn more on the page below, which includes two short videos (one for patterns and one for screening) and a very large discount.
The page below also includes the video ‘How to use Stock Charts in 5 Minutes’ so whether joining Pattern Finder as a member or not, hopefully there is some value to visiting the page: Learn about Pattern Finder
Thanks for reading, friends.
Always sharp reads with chart , thanks !