Bullish and Bearish Charts With Backtests
Lede
Today we will go with our normal examination of bullish and bearish charts, but we will take the next step in the evolution of our analysis, by integrating results (backtests) from our TradeMachine® product for one of the charts.
I asked Chat-GPT (4.0) to describe TradeMachine and it did a reasonable job. (I deleted some of the errors.)
CML TradeMachine is a comprehensive stock and options backtesting platform designed to enhance your trading strategy development and optimization process.
Offering an easy-to-use interface, this platform enables users to rigorously test their trading ideas using historical market data, helping them make data-driven decisions in the financial markets.
Key features of CML TradeMachine include:
• Comprehensive Backtesting
• User-friendly Interface
• In-depth Analytics
• Continuous Updates
For non TradeMachine members, please note that the first part of this post uses both TradeMachine and Pattern Finder, so the backtesting results we share here are not a part of Pattern Finder.
I just don’t want people confused about what is and what is not available in Pattern Finder.
You can learn more about TradeMachine here:
OK, OK, time for charts…
Bullish Charts
We start with ticker PAYC, but this time we did not start with a Pattern Finder screen, we started with the Today Tab in TradeMachine.
You can read about the process within the Today Tab here.
Here is the PAYC chart, and TradeMachine identified it due a pre-earnings pattern - specifically that PAYC has had a tendency for pre-earnings optimism two-weeks before the event:
We can see that PAYC is an a recent uptrend, and while it is right on a point of congestion, there is moderate room to trend resistance (green line).
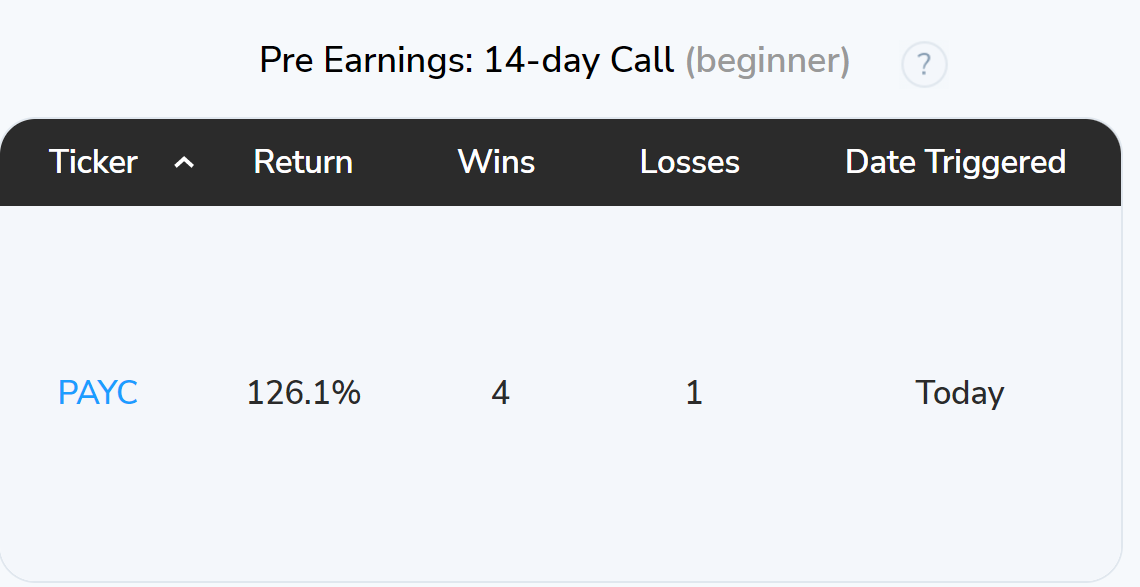
As for the pattern, historically, this next image is the from the Today Tab of TradeMachine where it tests getting long a slightly out of the money call (40 delta) two weeks before earnings and then closing the trade before earnings (no earnings speculation).
We don’t include the details of the backtest and reserve that for TradeMachine members, but summary statistics are OK:
The chart has an uptrend, there is moderate room to trend resistance and a history of a small pre-earnings move to the upside.
Next we will turn to a screen from Pattern Finder: “Bullish Charts; 3-yr Charts; Trend Support and Resistance Lines.”
We pluck out cyber security firm PANW.
Here is the 3-year chart where we ask Pattern Finder to draw the trend support (red line), trend resistance (green line), as well congestion lines (pink), the PnL zones (green and red shaded areas) and the CANSLIM patterns.
Note how PANW is “walking up support” making a series of higher lows, although there was a dip through support in early 2023:
PANW is near all time highs, so there can be some tempered enthusiasm here as well, but in general, climbing up support of higher lows is a constructive chart. Please be aware of earnings risk - charts aside, earnings day moves, in our opinion, are fairly random.
For another chart similar to PNAW, readers can peruse ticker CBOE.
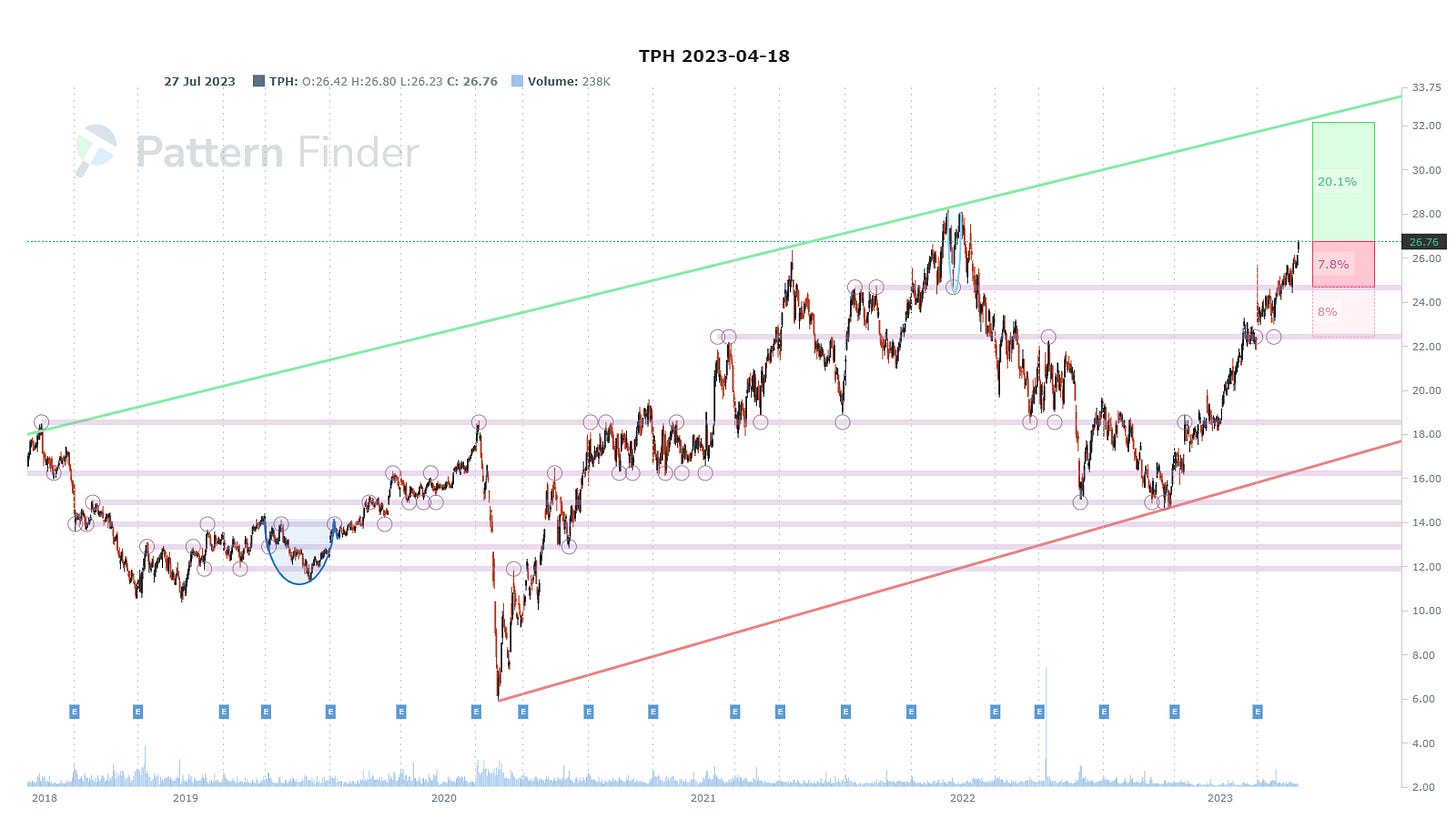
Finally, we look to ticker TPI from that same screen. TPI is an alternative asset management firm and does have some real estate in its portfolio.
There has been an abrupt rise off of support, it’s through congestion lines, and may well be headed to that multi-year high.
We can zoom in for clarity:
A swing trade could set the stop 7.8% lower at nearest downside congestion and look for an upside target either at the multi year high or trend support.
Before we turn to bearish charts, we share some tickers that showed up on the “RS Breakout on High Volume” screen in Pattern Finder.
BBAI, CDLX, HBIO, PKX, TAST, and TESS. We leave the chart work for those interested.
Alright, next to some bearish charts.
Bearish Charts
We start with ticker HFWA. This is a small regional bank.
We found this chart and several others from the “Bearish Charts; 3-yr Charts; Nearest Congestion or Trend” screen in Pattern Finder.
The stock has plummeted through trend support and a speculator could look at a 17% lower target at ~$16 and a loss zone exit about 5.4% higher. We note that regional banks are in the midst of earnings reporting - here comes the volatility, which could be up or down.
Similar weak charts in this sector can be found from the same screen including tickers BCBP, NFBK, RBB, RMBI.
Alright, that’s it for today!
Conclusion
You can do this yourself (not including backtesting) inside Pattern Finder; it takes about 3 seconds per chart, if that.
We are offering a huge discount on the page below and some demo videos to explain the technology. Pattern Finder: The Next Era of Charting.
The final price of Pattern finder will rest about 5x higher than the introductory offer found on the page above - and that page locks in your low price.
Thanks for reading, friends.
Pattern Finder: The Next Era of Charting.
And, for those that want TradeMachine, our stock and option backtesting platform, you can watch an explanatory video and learn more here: TradeMachine - Discount


