Bullish Charts, Bearish Charts, Pre-earnings Optimism Backtests, Recession Play
Preface
Today we will review bullish and bearish charts, including backtests, and then provide a list of tickers for bullish and bearish set-ups for traders to peruse.
This time we share two backtests.
We continue on the path of the next step in the evolution of our analysis, by integrating results (backtests) from our TradeMachine® product for one of the charts.
CML TradeMachine is a comprehensive stock and options backtesting platform designed to enhance your trading strategy development and optimization process.
For non TradeMachine members, please note that the first part of this post uses both TradeMachine and Pattern Finder, so the backtesting results we share here are not a part of Pattern Finder.
I just don’t want people confused about what is and what is not available in Pattern Finder.
You can learn more about TradeMachine here:
Time for charts…
Bullish Charts
We start with a rare occurrence - ticker SONO showed up on the TradeMachine Today Tab, pictured below, and it also showed up on the “Bullish Charts; Multi-timeframe; Nearest Congestion or Trend” screen inside Pattern Finder.
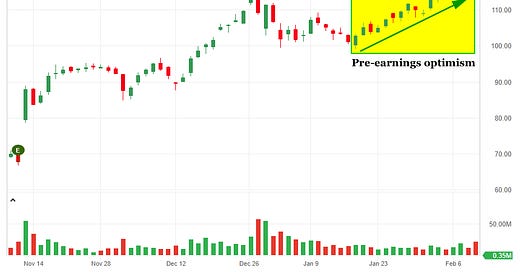
Here is the today tab, this scan looks for pre-earnings optimism 14-days before the report, buying a slightly out of the money call and closing before the report.
(We note that some of the images we are sharing have low resolution (intentionally) so we can fit more content into this newsletter writer, which has strict limits on size.)
Here is the actual pattern that is being searched. Note that this backtest does not look at nor test holding through earnings - this is strictly a “before the event” backtest.
The beauty is that while this has a nice backtest, with about a 60% win rate, it also has a great looking chart from Pattern Finder, pictured below.
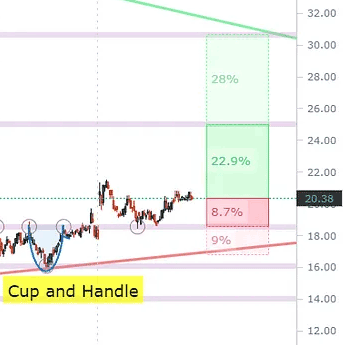
We let Pattern Finder draw in the congestion lines (pink), trend support (red), trend resistance (green), target zones (shaded boxes) and CANSLIM patterns:
We zoom in for clarity (low resolution):
Next we turn to the Today Tab in TradeMachine and look at the 3-days before earnings scan. This uses trading days to count to three (excludes weekends and holidays).
This is actually not my favorite scan - it’s a little too short-term for me, but it’s still used by many members.
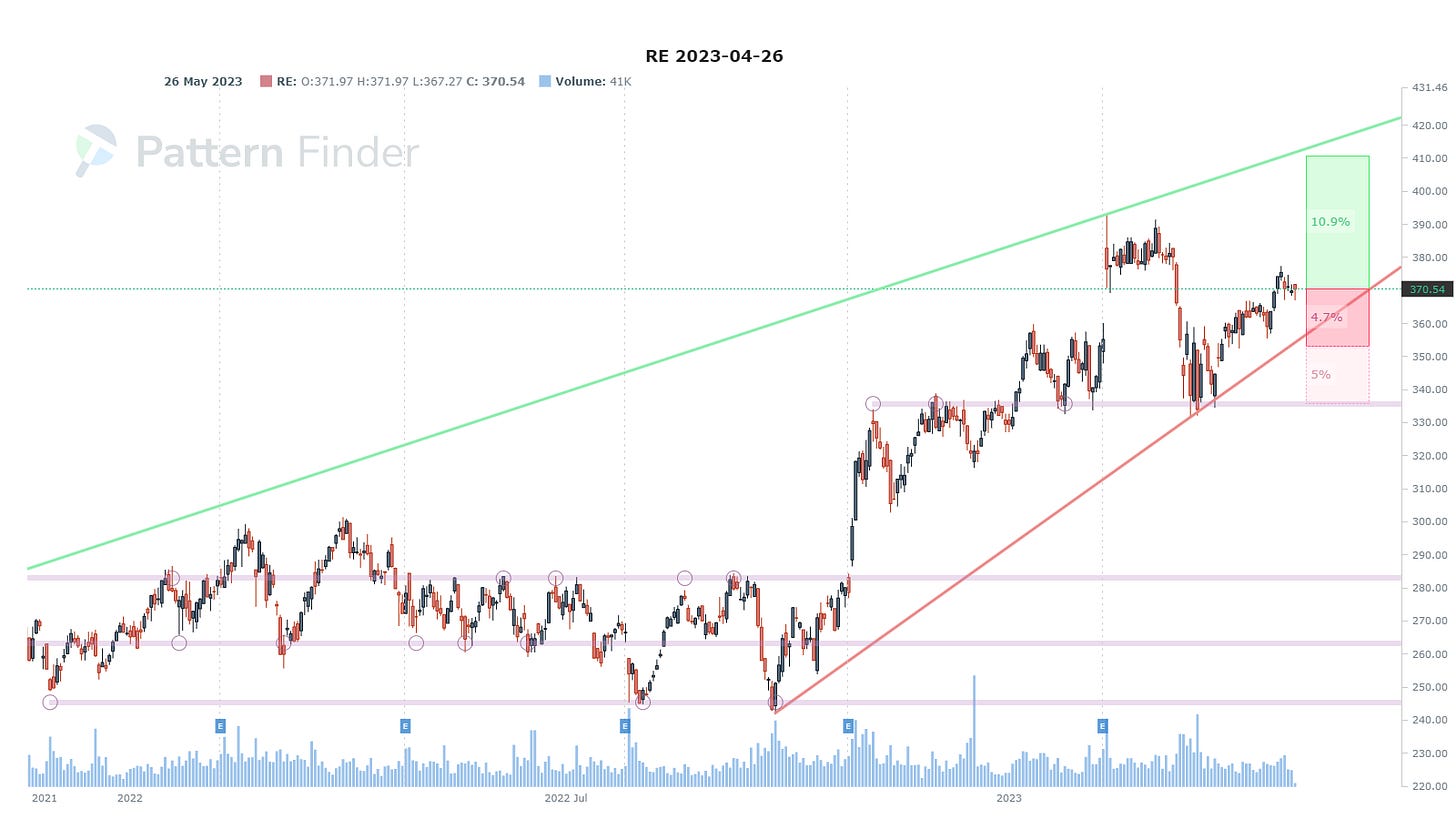
We find ticker RE:
And here is the RE chart from Pattern Finder - and up trend and favorable risk:reward dynamics.
This marks the end of our use of TradeMachine in this post - the rest is entirely Pattern Finder driven.
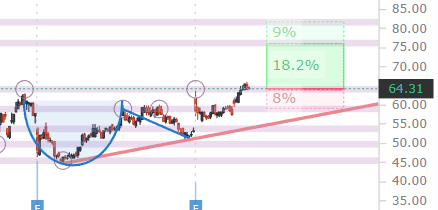
Finally, we turn to the Bullish Charts; 3-yr Charts; Nearest Congestion or Trend screen in Pattern Finder and find a bullish chart for ticker OLLI.
Ollie's Bargain Outlet Holdings, Inc. is a holding company, which engages in the retail of closeouts, excess inventory, and salvage merchandise.
This could be a recession hedge stock.
Here is the chart from Pattern Finder:
And we zoom in for clarity to see the target zone dynamics:
Bearish Charts
For bearish charts we turned to the “Bearish Charts; Multi-timeframe; Nearest Congestion or Trend” screen in Pattern Finder and pluck out ticker ARCH.
Here is the 3-year chart and we note three cups, the lowest one now acting as a potential target zone.
We can zoom in for clarity:
For more bearish ideas, we looked to the “Heavy Selling Volume” screen in Pattern Finder, and since we have space limitations on this newsletter writer (Substack), we can include a list of tickers which can be perused.
Not all of these have weak charts, but some do with heavy selling volume to boot.
ADTN, ANGO, ASAI, AUDC, BIG, CMBM, CVBF, DADA, DZSI, EVA, FN, LASR, ML, OPI, PPBI, RELL, SPWH, TRUP, TWKS.
Conclusion
You can do this yourself (not including backtesting) inside Pattern Finder; it takes about 3 seconds per chart, if that.
We are offering a huge discount and some demo videos to explain the capabilities, below.
The final price of Pattern finder will rest about 5x higher than the introductory offer found on the page above - and that page locks in your low price.
Pattern Finder: The Next Era of Charting.
And, for those that want TradeMachine, our stock and option backtesting platform, you can watch an explanatory video and learn more here: TradeMachine - Discount


