


Bullish Charts Update; New Strength Identified; Two Mega Caps to Watch

Lede
The Fed’s decision is out with a 25 bps hike and a hawkish summary of economic projections (SEP) that we discussed this morning in our other newsletter Daily Economics.
Today we look at two charts with newly found strength and then review the cyber security and mega cap charts we introduced as bullish before the FOMC decision.
Charts With Newly Found Strength
We start with mega cap MSFT and the 3-year chart.
We click the buttons to have Pattern Finder show us the following:
Congestion lines (pink)
Trend support (red)
Trend resistance (green)
PnL zones
CANSLIM patterns
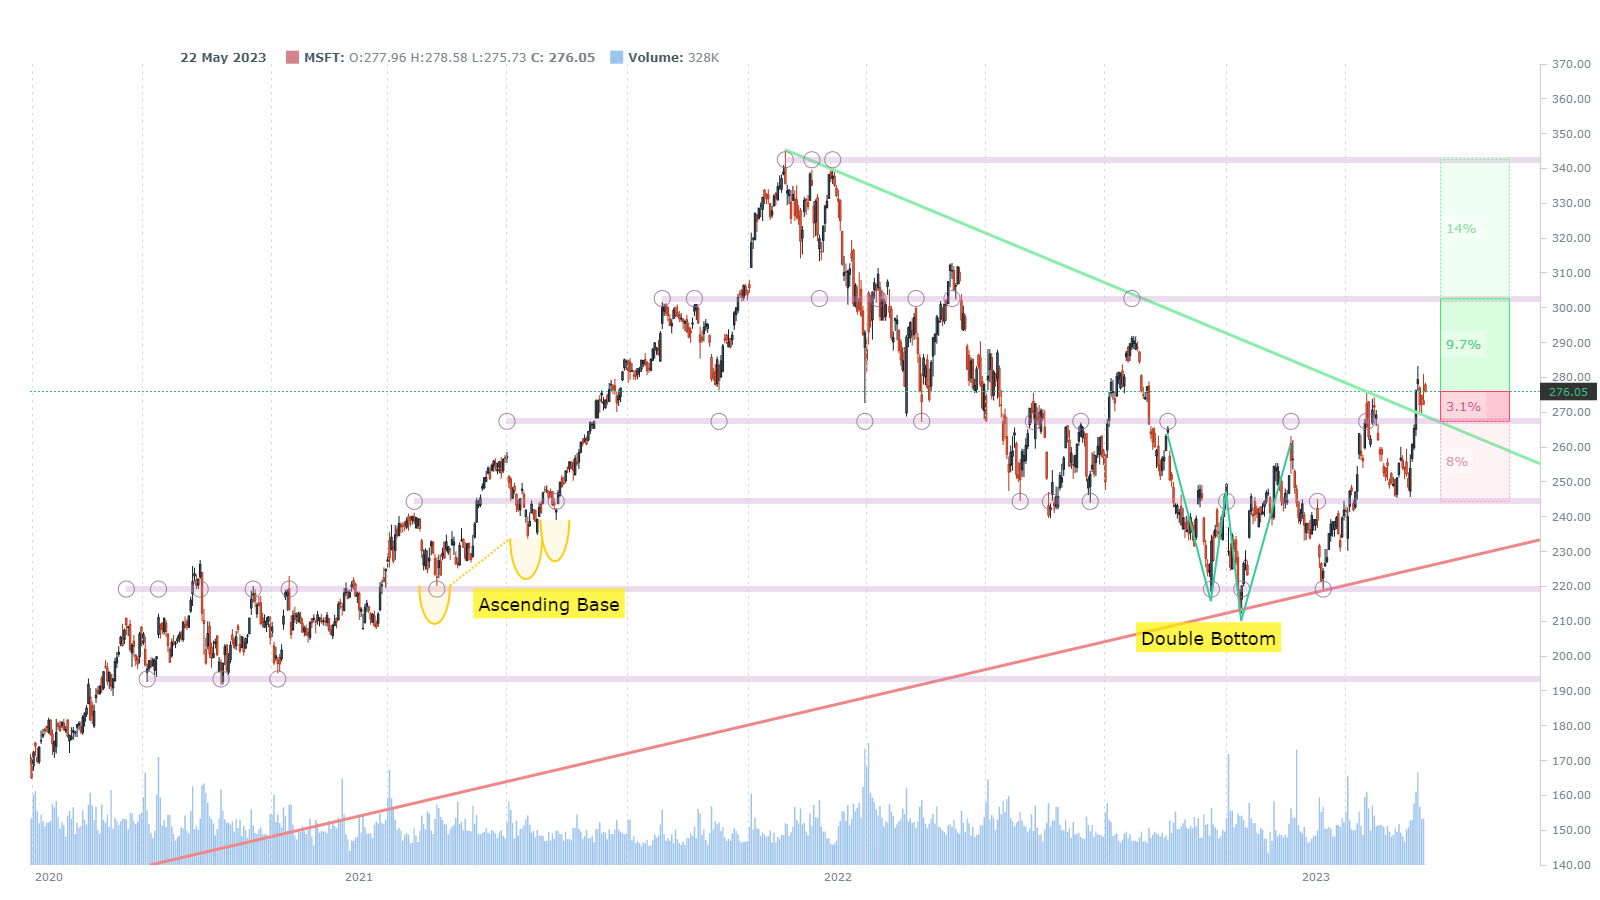
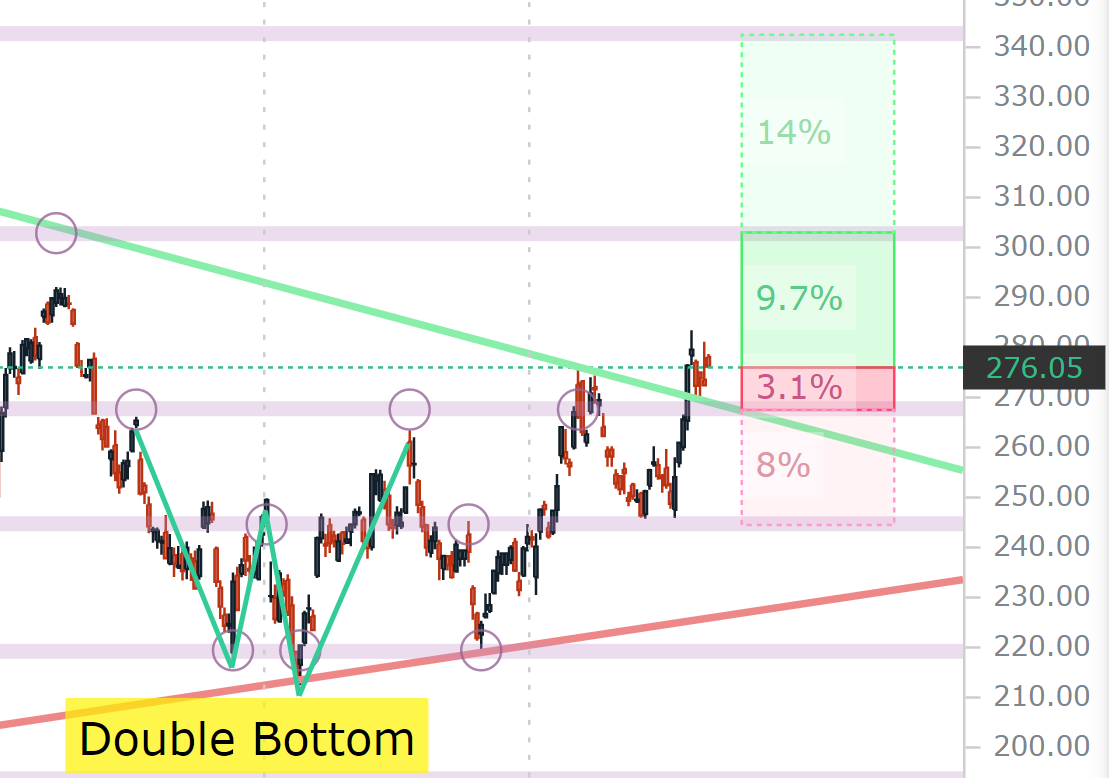
We can see that MSFT has popped above trend resistance, which was formed by a series of lower highs. We can zoom in and see the PnL zone set up, with possible stops and limits:
Next we turn to ticker RELX, which just hit a three-month RS (relative strength) of 80 (out of 100), has an uptrend and more room to the nearest upside target than the nearest downside target while maintaining a bullish channel:

The stock recaptured trend support after a large drawdown and has now moved above the next congestion line above that red line.
We zoom in for a clearer look at the PnL zones:

Next we review a few of the charts that we had posted in our prior post:
Reviewing Cyber Security and Mega Tech
We next turn back to the charts from our prior post on bullish chart set-ups into the FOMC meeting.
We start with PANW at the time of the prior post, the stock was $192.00. As of this writing the stock is at $193.41, moving up as the chart suggested:

Our summary from prior read as the following:
At congestion;
Gap filled;
Room to resume up trend of higher highs
Rising 50-day simple moving average (SMA)
Loss zone: ~$178
Profit zone: ~$240
And we zoom in to assess the potential trading zones:

Next, we turn to CRWD. At the time of the prior post, the stock was $133.55. As of this writing the stock is at $135.00, moving up as the chart suggested on a bullish move from FOMC:

We wrote last time the summary and repeat it here:
Through trend resistance (green line)
Up trend
Stretch upside target the base of a prior ascending base (yellow line)
Loss zone: ~$120
Profit zones: ~$150; ~$170; ~$180
And we zoom in:

Finally, we turn to OKTA, the third of the security stocks we examined in the prior post:
OKTA was at $84.71 in our prior post and has done little since, now printing at $84.40.
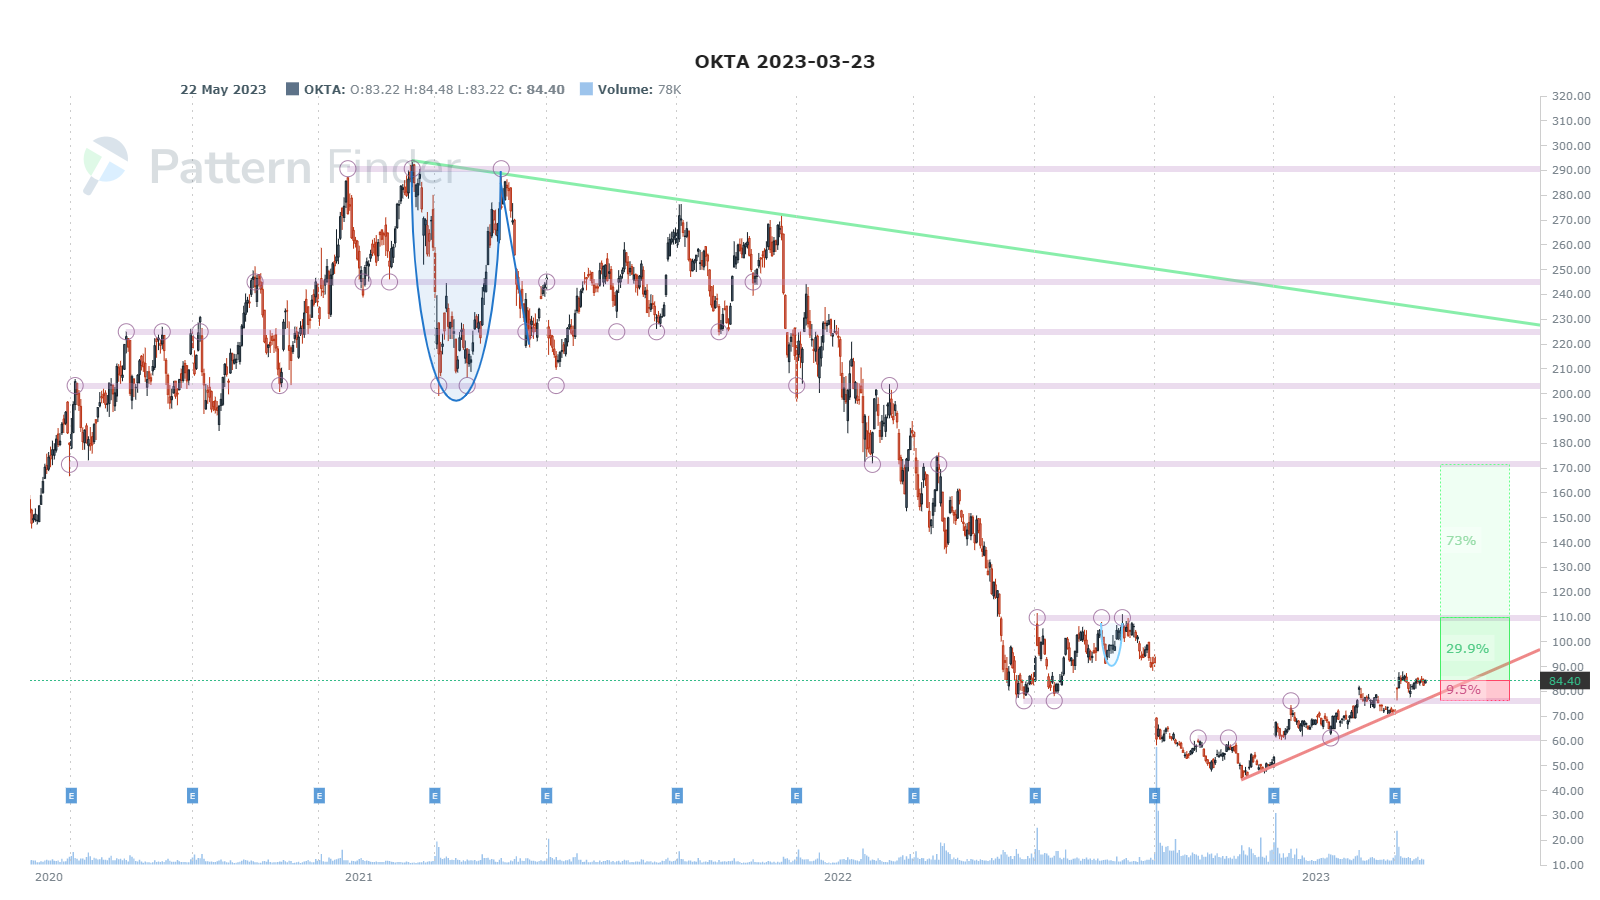
Our prior summary reads as the following:
Up trend
‘Walking up support’
Inside a prior gap down
Loss zone: ~$73
Profit zone: ~$110
We zoom in:

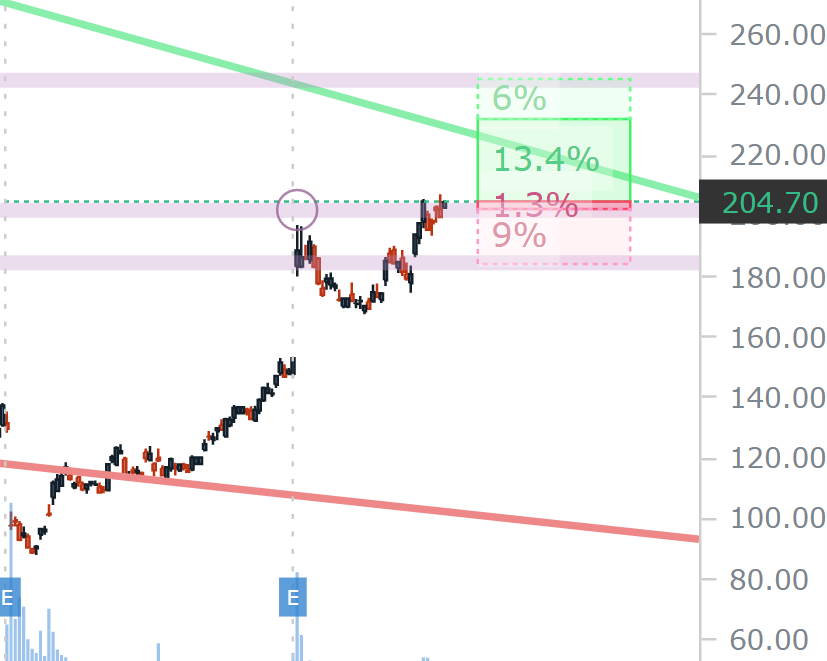
Then we looked at mega cap META which was at $200.92 in the prior post and is now trading at $204.70.

We repeat the set-up:
Up trend
Gap filled
Perhaps at a double top if it fails here
Another large gap to fill starting at ~$240
Loss zone: ~$180
Profit zone: ~$235, ~$242
We zoom in:
Next Steps
You can do this yourself inside Pattern Finder; it takes about 3 seconds per chart, if that. Screens find the charts to look at if you don’t have your own watchlist.
We are offering a huge discount on this page: Pattern Finder: The Next Era of Charting
Thanks for reading, friends.
nice