


Bullish Chip Stock; Bullish Sentiment; What About the Tails?

Preface
Today we’ll look for bullish charts on stocks with positive sentiment and then positive tail and skew characteristics.
The process we will follow is this:
Pattern Finder driven algorithms find bullish chart set-ups
Pattern Finder defines upside and downside targets
CML-GPT does sentiment analysis
CML-GPT (our AI) does tail and skew analysis
TradeMachine backtests an option trade over the last year
Let’s do it.
Bullish Charts
Step requires that we use Pattern Finder’s screen. We go to the “Directional Charts” section and then use the “Bullish Charts; 3-yr Charts; Nearest Congestion or Trend” screen.
We get a nice looking 3-year chart:

But… if we look closely, we can see that KLAC is at a multi-year high… That could be a stretch for a bullish swing trade.
There would have to be strong sentiment and reasonable tail behavior to adjust the probabilities in a long trader’s position.
So, we start with a sentiment question:

And here was the answer our CML-GPT AI gave us:
News Sentiment
I think of sentiment as given from 1 to 100, where 100 is the most bullish. My sentiment is driven by my news reading algorithm and then my volume, relative strength, and stock movement algorithms. I'll start with news:
The news sentiment rating for ticker KLAC is 70, which is somewhat bullish. The headlines suggest that KLA Corp. is making progress in advancing the electrification of the automotive industry, which could lead to increased demand for their products. Additionally, the announcement of upcoming investor webcasts suggests that the company is confident in their future prospects. The mention of a chip stock that could benefit from dividend growth in the EV industry also implies potential growth for KLA Corp. Overall, the news headlines suggest a positive outlook for the company.
Final Sentiment Score Adjustments
Over the last 30-days, the volume on up days was 1.3x higher than on down days so I have adjusted the sentiment up.
Three month RS (relative strength) is 89 out of 100.
The final sentiment score I computed was 76 with a 6 point adjustment beyond news.
The sentiment reads pretty bullish and there were some adjustments based on strong buying to selling volume and a strong 3-month RS. (All of this data that exposed to our AI comes from Pattern Finder).
Then we did a tail analysis:

Here are those results:

It’s the upside to downside kurtosis (fatness of tails) and the upside to downside skew (asymmetry of stock returns) that interests us.
Both are in the wrong direction from what would be optimal. We want the upside to be larger than the downside for each and we do not have that.
This one feels like a stretch, but it’s also very personal.
We can backtest a simple short put spread strategy once a week (but always avoiding earnings) and it turns out this tail and skew thing is pretty helpful because while KLAC beat market returns (+27% vs 3.9% for S&P 500), doing something pretty benign on the bullish side lost money:

But… if we have a stock that rises, which KLAC has, and have a stock with rather larger discrepancy between upside and downside tails (where downside tail moves are larger and more frequent), then hypothetically if what we’re doing has value, an option strategy that is bi-directional should work better than just a bullish trade.
And, it turns out, yes, that is the case.
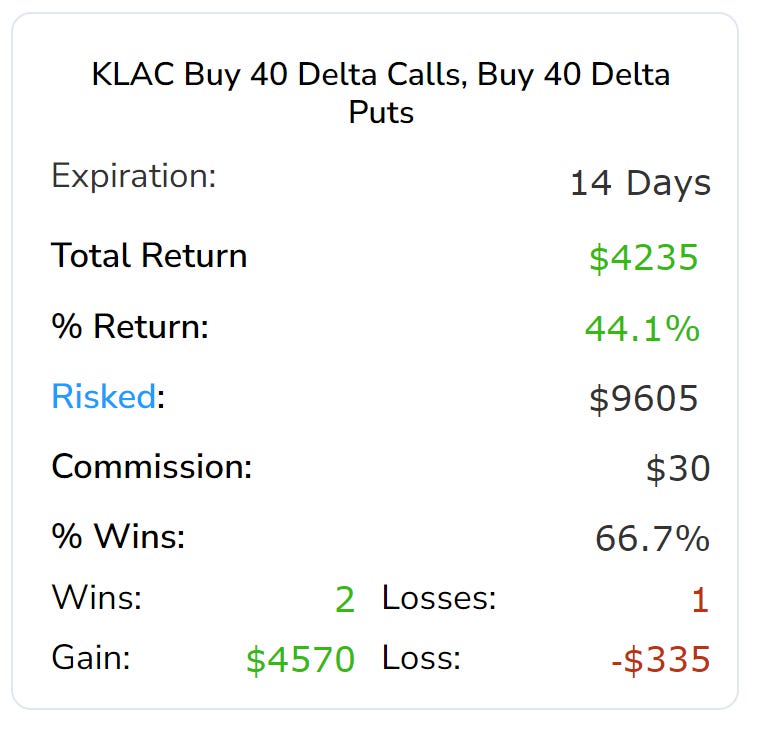
Here are the results of getting long a 14-day strangle (buying an out of the money call and an out of the money put), but only when KLAC satisfies certain technical requirements.
And… viola:
The technical requirements for this volatility trigger are reserved from TradeMachine members (membership has its privileges), but you don’t need a TradeMachine subscription to understand what’s going on nor do you need to trade options.
Tail analysis discrepancy at this scale can override a bullish stock chart, and yes, there are ways to play that in the option market too, as demonstrated above.
Does this mean that KLAC is a poor bullish set-up? No, we can’t say that. But we’d like even better set-ups.
Charts do matter - and target zones do matter, in and of themselves, but more knowledge is better.
What we can say is the following…
… the point of starting with KLAC is to remind all traders that it takes a lot to really circle a trade.
And, yes, absolutely, just using charts can work, but adding layers of more knowledge might work even better.
In this case, we can see it objectively with backtests.
So, today we leave you with just this one chart and analysis because it’s not just a chart - it’s a process.
We are gearing up for the full release of all of these tools and historical data into Pattern Finder and TradeMachine.
We will be releasing this on June 29th, and we will do so in a webinar to walk everyone through it!
You can register for the webinar to check it out when it goes live:
Webinar: Turning AI, ChatGPT, and LLMs into Profits
Open to all:
The goal of this webinar is to show how profits were made with new AI driven computations we are integrating into TradeMachine and Pattern Finder. It's not for fun; it's for profit.
Join us as we unveil the capabilities of our unique integration with ChatGPT, which harnesses real-time financial data, chart data, trading data, and innovative statistical algorithms.
During this event, we'll take you on a deep dive into scans, screens, and backtested results - not just for a couple of companies, but thousands; not just over one year, but spanning several years.
We will introduce full blown strategies.
We also introduce our AI driven sentiment rating - which can be used on any stock integrating recent news, buying / selling volume, relative strength, and much more!
We look forward to seeing you there.
Register for the webinar here.
Obviously (we hope it’s obvious), our next posts will be more about charts and analysis that check all the boxes rather than one that doesn’t - but we need to start with the “what might be better” before we show the “this is better.”
Conclusion
We hope this was instructive and thank you for reading.
Pattern Finder and TradeMachine are about to get massive upgrades that we just wrote about - right on schedule - right as we said - about three weeks from today.
A scannable and more advanced version of this analysis, and a lot more, is coming.
If you’re not an option trader, then Pattern Finder will be your powerhouse.
If you are an option trader, then TradeMachine will be your powerhouse.
And if you want both, we offer Pattern Finder to TradeMachine members for just $11 / mo.
The products are going to improve - slowly, and then all at once. You can see it happening.
The prices are going to go up too.
But the price for members that join before we integrate our vast libraries of AI over the coming weeks, months, and years, that are in development, like this tail analysis report turned into scannable data, will not go up.
Learn about Pattern Finder here.
Learn about TradeMachine here.
Thanks for reading, friends.
Legal
The information contained on this site is provided for general informational purposes, as a convenience to the readers. The materials are not a substitute for obtaining professional advice from a qualified person, firm or corporation. Consult the appropriate professional advisor for more complete and current information. Capital Market Laboratories (“The Company”) does not engage in rendering any legal or professional services by placing these general informational materials on this website.
The Company specifically disclaims any liability, whether based in contract, tort, strict liability or otherwise, for any direct, indirect, incidental, consequential, or special damages arising out of or in any way connected with access to or use of the site, even if we have been advised of the possibility of such damages, including liability in connection with mistakes or omissions in, or delays in transmission of, information to or from the user, interruptions in telecommunications connections to the site or viruses.
The Company make no representations or warranties about the accuracy or completeness of the information contained on this website. Any links provided to other server sites are offered as a matter of convenience and in no way are meant to imply that The Company endorses, sponsors, promotes or is affiliated with the owners of or participants in those sites, or endorse any information contained on those sites, unless expressly stated.
Since the kurtosis and skewness numbers are quite new to most of us, it would be very helpful for future enhancements to have say a 1-100 scale (100 being more in the money) or simply a green or red indicators to help provide context.