


Bullish Energy Stocks On the Move with OPEC+ Cut; Mega Caps; Large Caps; Mid Cap

Lede
Over the weekend Bloomberg reported this: OPEC+ Makes Shock Million-Barrel Cut in New Inflation Risk.
Energy stocks are rising and we now turn to the opportunity.
Bullish Energy Charts
To find bullish charts in the Energy sector we started with a fairly simple screen:
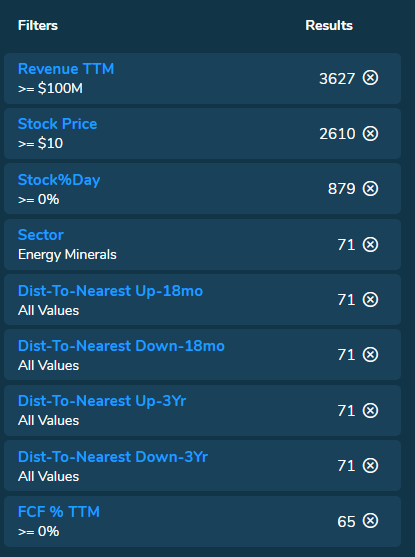
We want Energy companies with more than $100M in revenue, positive free cash flow (FCF), up on the day, and with a stock price above $10.
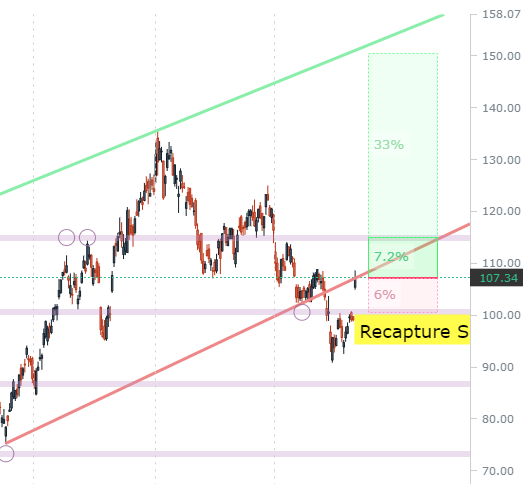
Let’s start with the megas. Here is the 3-year chart for Chevron (CVX).
We ask Pattern Finder to draw in the following:
» Trend support (red line)
» Trend resistance (green line)
» Congestion lines (pink)
» Distance to next upside target (green fill)
» Distance to next downside target (red fill)
» Patterns
Once Pattern Finder is done with its work, we can see a nice upward channel with higher lows and higher highs.

We also see a recapturing of support and the gap up today.
We can zoom in for the PnL zones:

The upside target would be about 18.5% higher and downside would be a failure to hold recaptured support.
COP has a very similar chart:

We zoom in:
The PnL zone for the upside is limited by the next congestion line (pink line), but a trading tactic could be similar to CVX - out with failed support, upside to congestion or higher.
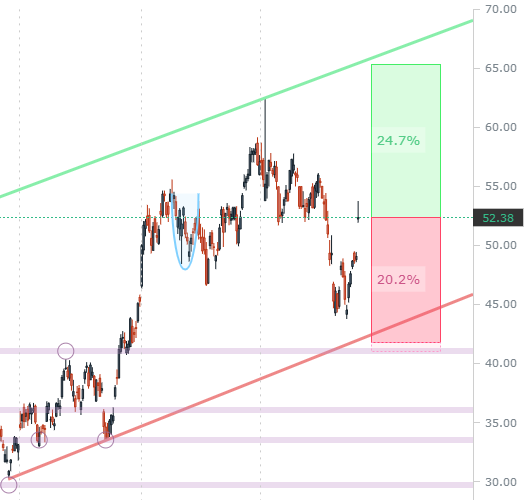
Out of the mega cap realm and into large caps, EOG has a 5-year chart that mirrors the other two mega caps as well: an upward channel and a recapture of support.

We can zoom in to see the recovered support and the PnL zones:

Next we look at SLB, which has one of the strongest charts. While it has similar characteristics of the prior charts, it has not faced a failed support.

The gap up could be seen as more convincing since support wasn’t violated.
We zoom in:
There’s more upside room to nearest resistance than downside in this chart as well.
More Tickers to Peruse
Some other interesting charts for Pattern Finder members to examine are the following:
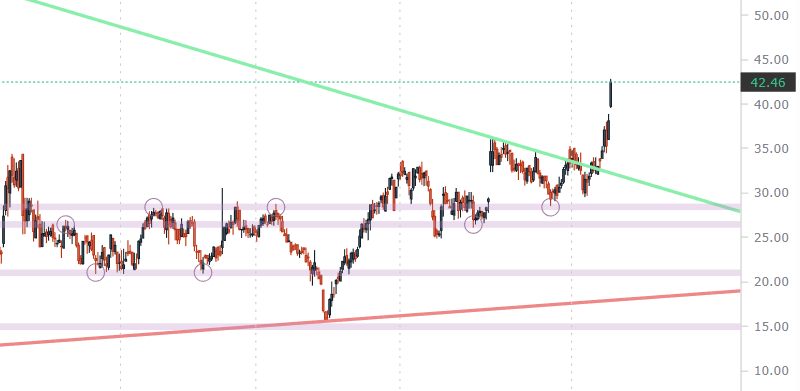
REPX: Through trend resistance:
CIVI: Promising reward:risk set-up using Pattern Finder’s support and resistance lines.

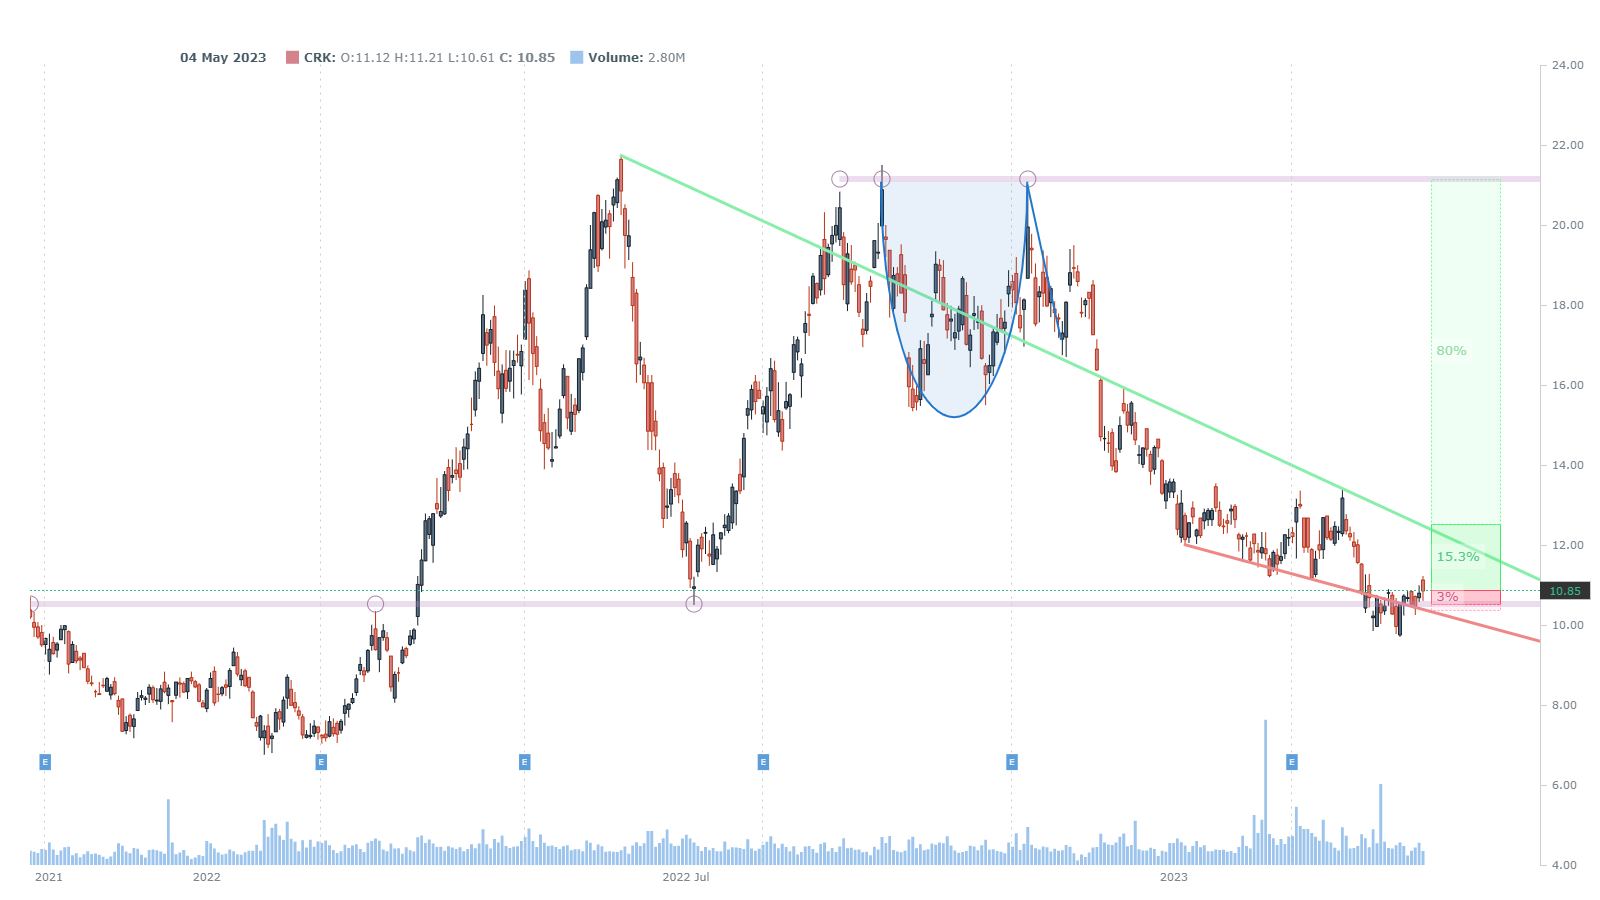
CRK: 18-month chart potential large breakout to upside.
AR and CEIX: Earlier stage of the mega cap stock pattern - with support just today recaptured.


TALO: V-shaped recovery on the 18-month chart.

Conclusion
You can do this yourself inside Pattern Finder; it takes about 3 seconds per chart, if that. Screens find the charts to look at if you don’t have your own watchlist.
We are offering a huge discount on this page and some demo videos to explain the technology. Pattern Finder: The Next Era of Charting.