


Bullish Entanglement is Here - The Collision of Charts, Tails, and Sentiment

Preface
Today we’ll look for bullish charts on stocks with positive sentiment and then positive tail and skew characteristics.
The process we will follow is this:
Pattern Finder driven algorithms find bullish chart set-ups.
Pattern Finder defines upside and downside targets.
CML-GPT does sentiment analysis.
CML-GPT (our AI) does tail and skew analysis.
TradeMachine backtests an option trade over the last year.
When we find the first three of those characteristics listed above align in one direction (either all bullish or all bearish), we will call it “entanglement” (new jargon for us).
So, we are looking for “bullish entanglement.”
Let’s do it.
Bullish Entanglement
We start with ticker GLBE and the 3-year chart.
We let Pattern Finder draw in support, resistance, congestion, shapes, and target zones.
We also call out and then zoom in on the recent portion of the chart:
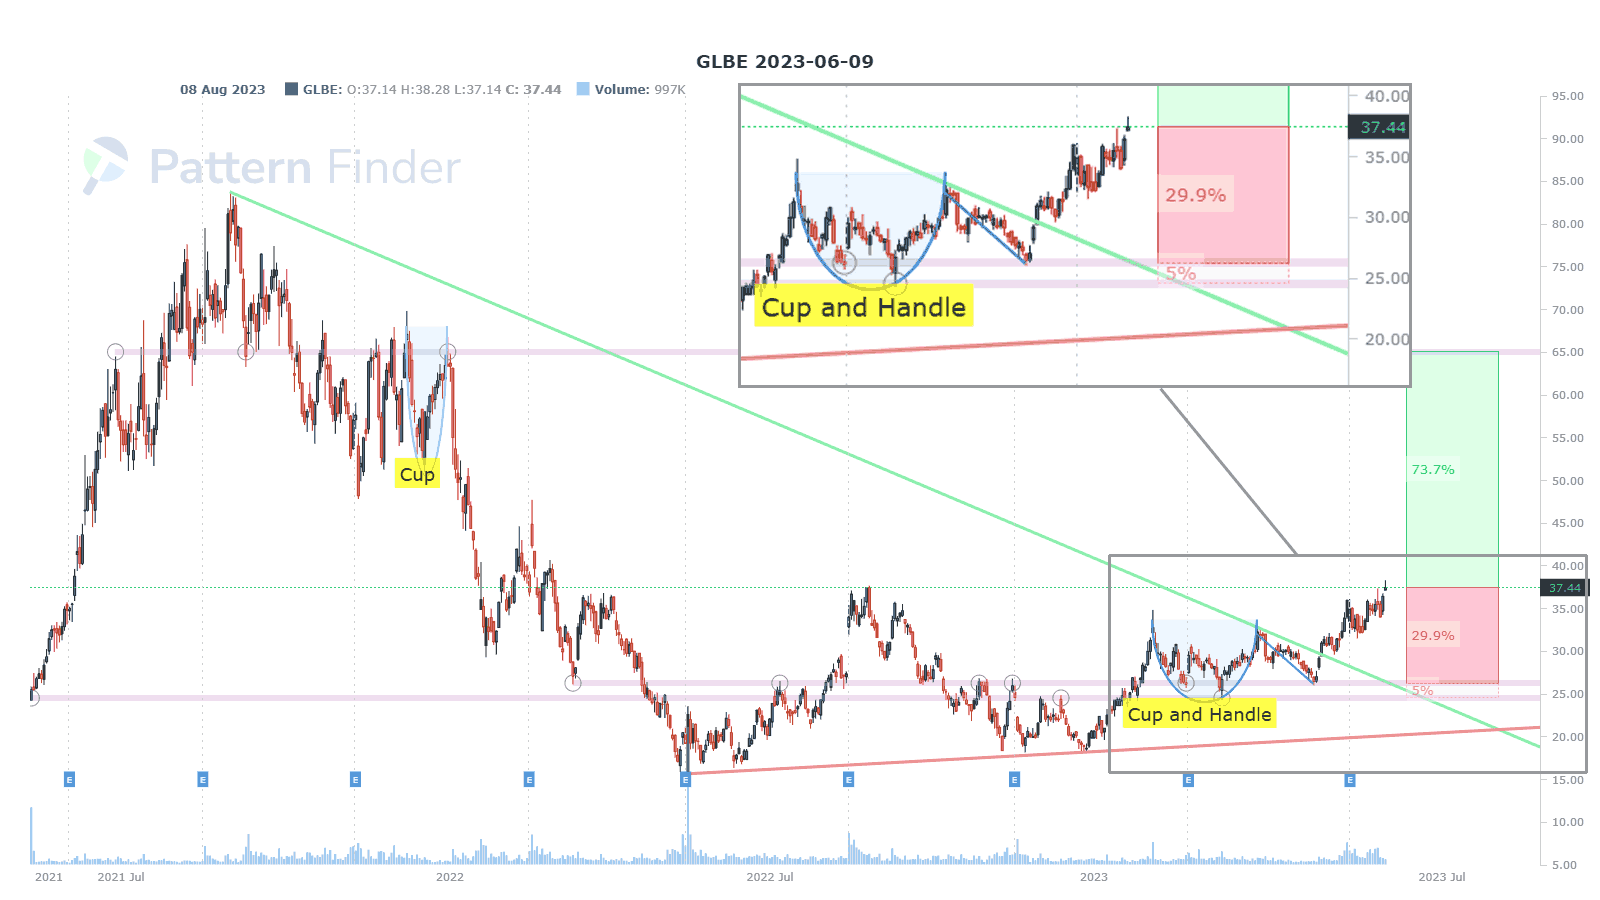
We can see a breakout above that green line (trend resistance) and a push higher. Pattern Finder’s algorithm has not yet adjusted the resistance line, meaning it is waiting for confirmation.
The next congestion point would be the base of the cup back in the end of 2021.
So, we have our bullish chart - though it is a bit tentative with new resistance yet to be drawn.
Next, we did our tail and skew analysis:
We asked this of our AI.

And we got this answer:
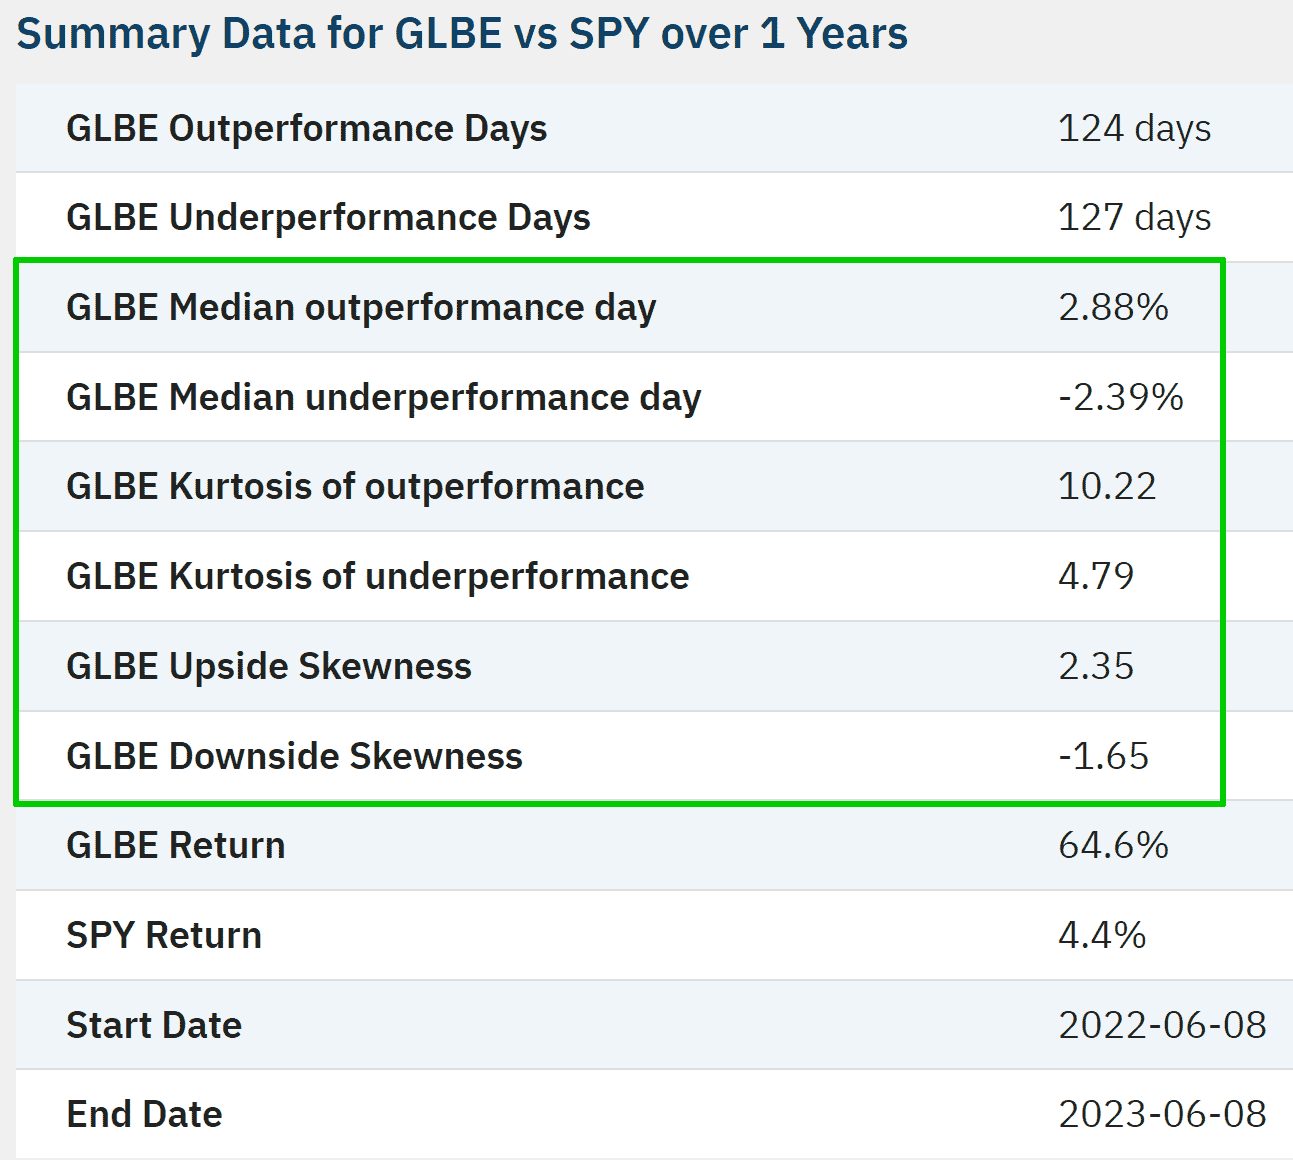
We note three phenomena:
For days when GLBE outperformed the S&P 500, that amount (2.88%) was larger than the amount when it underperformed the S&P 500.
The fatness of the upside tail (“outperformance kurtosis”) is larger than that of the downside tail (10.22 vs 4.79).
Finally, the asymmetry of returns for upside moves (“upside skewness”) is larger than the absolute value of the asymmetry for downside moves (2.35 vs 1.65).
We can kind of see this with an “eyeball test” when we examine the daily returns comparison chart - it just looks like the green bars are larger, both in the extremes and at the median:

So, that means the following:
There are more frequent extreme positive comparative returns (also known as 'fat tails') compared to negative returns for GLBE than the S&P 500 .
In other words, the potential for unusually large daily outperformance returns is higher.
The larger absolute upside skew versus downside skew compared to the S&P 500, means that GLBE tends to outperform the market by a large margin more frequently than it underperforms by a similar margin.
So, in the study period for this analysis (2022-06-08 to 2023-06-08 ), GLBE has had the best of both worlds - more frequent outperformance and larger tail upside than downside.
Finally, we check the sentiment:

News Sentiment
I think of sentiment as given from 1 to 100, where 100 is the most bullish. My sentiment is driven by my news reading algorithm and then my volume, relative strength, and stock movement algorithms. I'll start with news:
The news sentiment rating for GLBE is 70, which is somewhat bullish. The headlines suggest that Global-e Online is a good investment opportunity and that the company has reported positive Q1 2023 results. The article also highlights that Global-e Online is a top growth stock to buy before it skyrockets. Overall, the news suggests that GLBE is a promising investment option.
Final Sentiment Score Adjustments
Over the last 30-days, the volume on up days was 1.3x higher than on down days, but I am not adjusting sentiment.
Three month RS (relative strength) is 93 out of 100. A value of 90 or above indicates stronger sentiment, so I have adjusted the sentiment score up.
The final sentiment score I computed was 79 with a 9 point adjustment beyond news.
Alright, with a bullish chart, bullish tail behavior, bullish (historical) skew, and bullish sentiment we have our bullish entanglement.
Tech has been on a tear, and all of this is, of course, just probabilities, but yeah, this checks all the boxes for the next short- to medium-term.
And since we’re here, with bullish entanglement, following a specific option strategy should have done very well.
In particular we have been sharing the results of a short out the money put spread rolled every week, with the only rule being to never trade earnings (always leave a four-day window around the event with no positions).
We do so with GLBE through our backtesting engine product called TradeMachine and get this result:

It’s magic! (It’s not magic, it’s the right tools.)
Now we will do another stock, but we won’t share all of the various details of the kurtosis and skew, and just note the results.
To find our next ticker, we looked at the “Pattern Breakout” part of Pattern Finder:

We pluck out ticker ANSS.
ANSYS, Inc. engages in the development and marketing of engineering simulation software and services.
We present the 3-year chart below and call out the recent period.

This is in an interesting chart: the stock is in between the top and bottom of a prior ascending base and also at the formation of a prior handle of a cup.
Further. it’s right on congestion.
But it also has a rising trend support (the red line), which is formed by a series of higher lows. If we follow the letter of the law, it does have more room to the next upside target than the next downside target, but that would be using a very tight stop at just a couple dollars lower.
Since it has followed this “walking up” support pattern we can call it a bullish chart set-up.
When we turn to the tail and skew analysis, we get that the tail fatness (kurtosis) of outperformance is 17.47 vs underperformance kurtosis of just 3.
The upside (outperformance) skew, which is a measure of the asymmetry of returns is 3.29 versus the downside skew which is -1.74.
So, this passes our second requirement for bullish entanglement.
Finally, when we ask our AI for sentiment, we get this:
News Sentiment
The news sentiment rating for ANSS is 70, which is somewhat bullish. The news headlines suggest that Ansys is making significant progress in expanding its simulation portfolio for semiconductor designers, which is likely to have a positive impact on the company's growth prospects.The acquisition of Diakopto is a major development in this regard. Additionally, Ansys has been recognized for its efforts towards sustainable aviation, which is likely to enhance its reputation and brand value.
The company's participation in J.P. Morgan's annual conference is also a positive sign, as it indicates that Ansys is gaining recognition in the technology and media sectors.
Overall, the news headlines suggest that Ansys is making strides in expanding its business and enhancing its reputation, which is likely to have a positive impact on its stock price.
Final Sentiment Score Adjustments
Over the last 30-days, the volume on down days was 1.12x higher than on up days, but I am not adjusting sentiment.
Three month RS (relative strength) is 65 out of 100.
The final sentiment score I computed was 70.
A sentiment score of 70 is (somewhat) bullish, and that means we have satisfied all three of our requirements for bullish entanglement.
As for the option backtest of that same weekly short put spread - the results are far more powerful over the last six-months than the last year, but here are both, starting with six-months and then the last year:
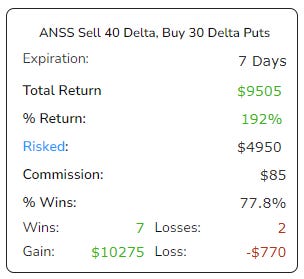

It’s magic again! (It’s not magic; it’s the right tools).
So, here are two stocks that satisfy bullish entanglement.
Clearly, the power will come in a software that does this:
Automatically (algorithmically) identifies bullish (and bearish) charts has it in a screener for fast action.
Computes upside and downside kurtosis and skew comparisons and has it in a screener for fast action.
Algorithmically computes sentiment.
And, for option traders, also does backtests.
There’s something special coming in addition to this, but let’s start with good news and then get to better news.
OK… the good news first:
The first three of the requirements listed above are what Pattern Finder will be by June 29th. It already does the first part, and combined with our free AI tool, you can already do the other two - excluding the screening part for kurtosis and skew.
In 20 days from today on our webinar, it will do the other two as well.
And the better news is that TradeMachine is the backtester, and it will have historical kurtosis and skew for backtesting in 20 days as well.
(There is better news coming below this.)
TradeMachine is already a massively powerful option (and stock) backtester - on June 29th it will have skew and kurtosis.
The price for the products will rise when the new capabilities are available but it will not go up for grandfathered in members.
So, if you’re interested, you can learn about either or both products here:
We note that TradeMachine members gain access to Pattern Finder for just $11 / mo.
Better News
We are on our way to training our own large language model (LLM), like ChatGPT but our own, for one very specific purpose: to forecast stock chart (price) evolution.
Yep, that’s coming too. It won’t be in a few weeks, but it will be here.
Thanks for reading, friends. Have a great weekend.
The author is long GLBE at the time of this writing.
Legal
The information contained on this site is provided for general informational purposes, as a convenience to the readers. The materials are not a substitute for obtaining professional advice from a qualified person, firm or corporation. Consult the appropriate professional advisor for more complete and current information. Capital Market Laboratories (“The Company”) does not engage in rendering any legal or professional services by placing these general informational materials on this website.
The Company specifically disclaims any liability, whether based in contract, tort, strict liability or otherwise, for any direct, indirect, incidental, consequential, or special damages arising out of or in any way connected with access to or use of the site, even if I have been advised of the possibility of such damages, including liability in connection with mistakes or omissions in, or delays in transmission of, information to or from the user, interruptions in telecommunications connections to the site or viruses.
The Company makes no representations or warranties about the accuracy or completeness of the information contained on this website. Any links provided to other server sites are offered as a matter of convenience and in no way are meant to imply that The Company endorses, sponsors, promotes or is affiliated with the owners of or participants in those sites, or endorse any information contained on those sites, unless expressly stated.