


Bullish Patterns, Backtests, Volatility Triggers, Bullish and Bearish Charts

Lede
The weekend is prep time.
Today we will review bullish and bearish charts, include a backtest, and then provide a list of tickers for bullish and bearish set-ups for traders to peruse. We also include tickers for non-directional trading as well. Today is a treat!
We continue on the path of the next step in the evolution of our analysis, by integrating results (backtests) from our TradeMachine® product for one of the charts.
CML TradeMachine is a comprehensive stock and options backtesting platform designed to enhance your trading strategy development and optimization process.
Offering an easy-to-use interface, this platform enables users to rigorously test their trading ideas using historical market data, helping them make data-driven decisions in the financial markets.
For non TradeMachine members, please note that the first part of this post uses both TradeMachine and Pattern Finder, so the backtesting results we share here are not a part of Pattern Finder.
I just don’t want people confused about what is and what is not available in Pattern Finder.
You can learn more about TradeMachine here:
Time for charts…
Bullish Charts & Volatility Triggers
We will start with a TradeMachine backtest from the Today Tab.
In this case, we selected a pre-earnings optimism backtest, but rather than looking at a straight call, we are looking at a diagonal (time spread and strike spread).
Here are the summary results for ticker CBOE.
We have written about the CBOE bullish chart, in general, through Pattern Finder, for a while now, and now it intersects with a repeating pattern ahead of earnings, which makes it extra tasty.
Here are the results over the last 3-years for CBOE:

Just to clarify the generic pattern we are testing for with this strategy, here is an illustrative chart - this is not a CBOE chart - it’s illustrative of the pattern itself.
Note that the speculation is not taking on earnings risk - this backtest is closed well before.

This signal is ever stronger if the prior earnings move was a gap higher, like this:

Alright, now that we understand what we are looking at in general, let’s look at CBOE in specific. This is the chart from Pattern Finder.
We let Pattern Finder draw in the following:
Trend support (red line)
Trend resistance (green line)
Congestion lines (pink lines)
Target zones (green and red rectangles)
CANSLIM patterns (in this case a cup and a double bottom)


And then we zoom in to see that the stock has been walking up support while making higher lows and moving through prior congestion.

For TradeMachine members, we note four tickers have shown up on of our favorite backtest scans - Volalility Bursts (aka ‘Long Strangle Technical’).
Take a look at those on the Today Tab.
For non Trademachine members, this is a four minute video on the trading and thought process behind volatility triggers:
That’s from TradeMachine.
The next bullish chart we will examine is ticker NGG - a UK based electricity and gas company.
This stock came up on the “Bullish Charts; 3-yr Charts; Trend Support and Resistance Lines” screen in Pattern Finder.
You will see a stock walking up support, higher lows, right at congestion, and with a favorable risk:reward chart set-up:
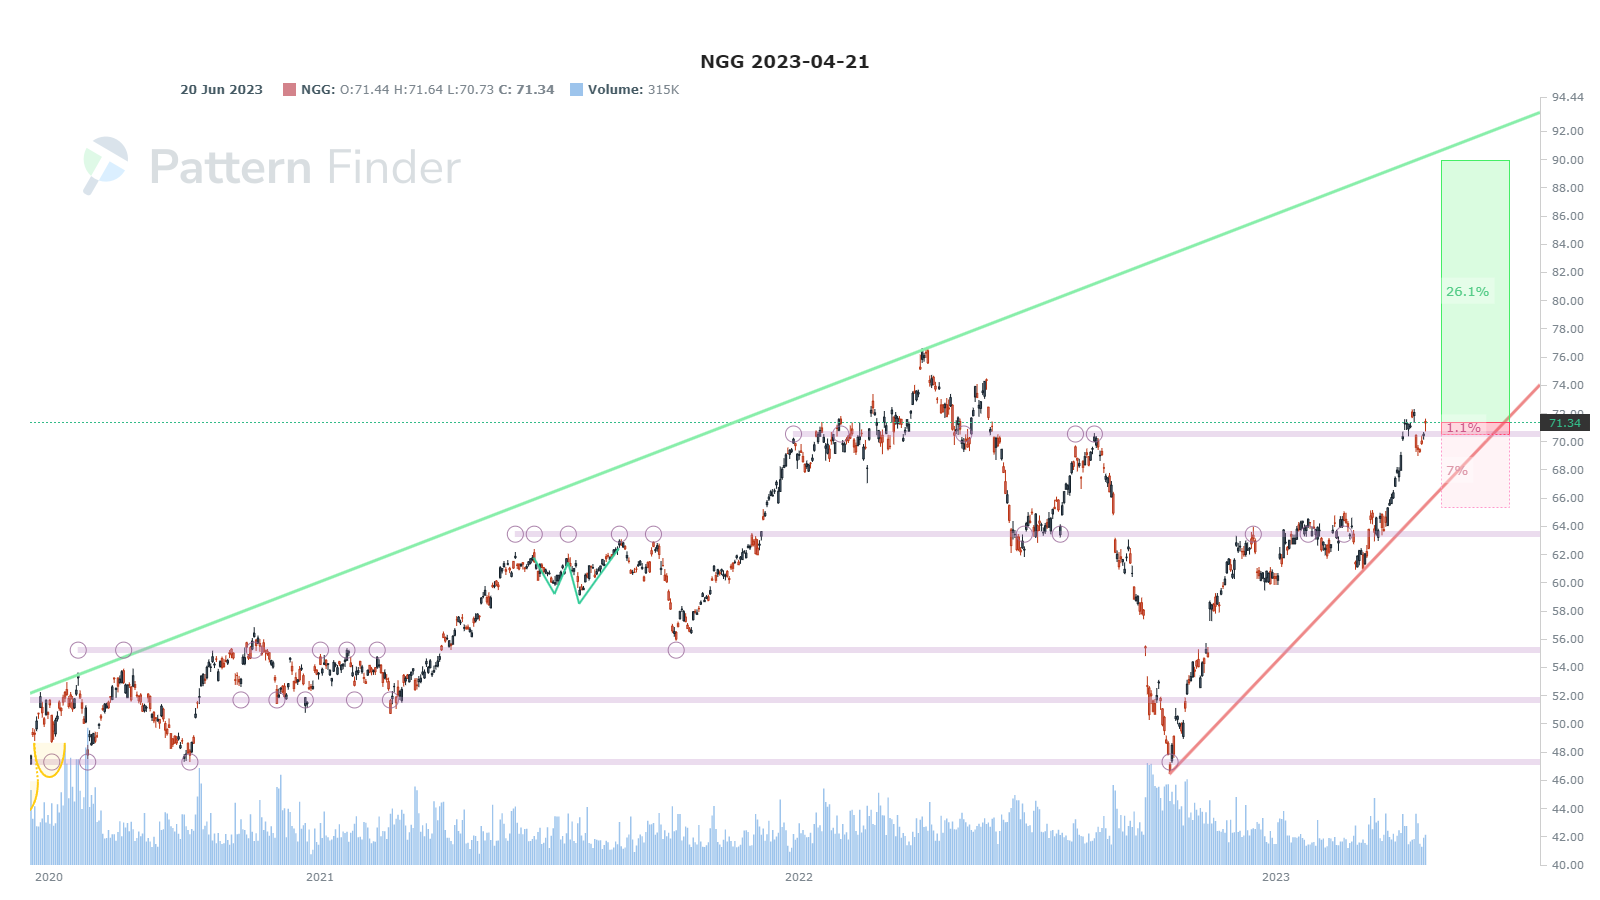
We zoom in in for clarity and too see that there is ~8% stop zone and quite a bit of upside potential.

Another stock with a similar looking chart is ticker ANSS. This stock too came up on the “Bullish Charts; 3-yr Charts; Trend Support and Resistance Lines” screen in Pattern Finder.
We share the 3-year chart below and, again, let Pattern Finder mark up the chart for us.
Note considerable congestion formed by a cup and handle and then the start of an ascending base. ANSS has pushed through that wall and has a slightly favorable risk:reward set-up.

Other charts that may be worth a look with this general set-up are the following:
CBOE, CPRT, CRM, LUNG, MASI, NGG, RELX, SKY, and TIGO.
Bearish Charts
Substack, the platform that publishes this newsletter, limits the number of images we can include in a post and still have it go out as an email.
So, we’ll share one more chart and then a list of tickers to examine for bearish analysis.
We pluck out ticker FN from the “Heavy Selling Volume” screen in Pattern Finder.
Here is the 3-year chart:

The stock has made lower highs and is right on prior congestion.
We zoom in:

Yes, an argument can be made that the freefall has been caught at that congestion line, but this isn’t a great looking chart and a test of that rising trend support (red line) looks awfully possible.
We note that in order to land on that screen a ticker has to have very week short-term relative strength (RS) and a weak “Buy Sell Rating” (our proprietary rating for buying strength and weakness).
FN has a 7 (out of 100) 3-month RS and a 3 (out of 100) Buy Sell Rating,
It is earnings season, so as we have written for the last few posts, there will be more volatility this month than the other two months of the quarter, so position and plan accordingly.
Some of the other tickers on the heavy selling volume (from that screen in Pattern Finder) are the following:
ASAI, CVBF, PPBI, and TWKS.
Pattern Finder members, there are in fact 31 total names to peruse.
Conclusion
You can do this yourself (not including backtesting) inside Pattern Finder; it takes about 3 seconds per chart, if that.
We are offering a huge discount and some demo videos to explain the capabilities, below. Pattern Finder: The Next Era of Charting.
The final price of Pattern finder will rest about 5x higher than the introductory offer found on the page above - and that page locks in your low price.
Pattern Finder: The Next Era of Charting.
And, for those that want TradeMachine, our stock and option backtesting platform, you can watch an explanatory video and learn more here: TradeMachine - Discount
Thanks for reading, friends, and have a great weekend.