


Chart Time: Mega Cap Review

Preface
Today we do our weekend work - looking at five mega caps, and update members on a very exciting upgrade coming to Pattern Finder (and TradeMachine) using our own integration with, and upgrade to ChatGPT.
We’ll start with that news and a timeline for product enhancements and then get to charts.
The Big News
ChatGPT driven AI is coming soon to Pattern Finder, TradeMachine (our most advanced trade analysis feature with option backtesting) and to Capital Market Laboratories (CML) in general.
We take a thrilling leap forward in AI innovation that has never been done before by unveiling a pioneering ChatGPT-driven tool for economic, financial, and stock chart data analysis, seamlessly integrated with real-time data.
This groundbreaking achievement unites the prowess of AI and up-to-the-minute data for the very first time.
To date, ChatGPT is extremely limited for use cases requiring current data, because ChatGPT’s “learning” is currently based on information with a hard data cutoff at September 2021.
There has been no meaningful way to effectively use ChatGPT or other powerful new AI tools for market and financial analysis.
That barrier has been broken and soon we will serve up insights unlike anything previously available, even through professional terminals that cost thousands of dollars to use. You can read more at the end of this post.
Timeline and What Pattern Finder and TradeMachine Members Get
We will be releasing version one of our real-time financial data powered ChatGPT tool to our free site www.CMLviz.com next week (probably).
That will be a version 1.0. We will collect data as investors, researchers, and traders use the tool. We will iterate on that tool for at least two weeks.
By then we should feel comfortable enough to integrate an advanced capability version into our pay products:
Pattern Finder (charting and screening)
TradeMachine (charting, scanning, option backtesting)
CML Pro (stock and economic research).
So, we expect the tools in better and more advanced form in products within about a month.
At that time, the price for Pattern Finder will go up for new users (but not for those already paying members).
We will add to the stock charts inside Pattern Finder on the fly not just with our current models for trend support, trend resistance, congestion, CANSLIM patterns, and PnL zones, but with price decompositions, like seasonality, return comparisons to other stocks or indices, forecast models, free form text to result screening, free form statistics (like correlations) and more.
For TradeMachine, we will provide all of that, and go even further, plugging backtest results into ChatGPT for a free form chat to backtest interface.
These integrations into our pay products will be iterated upon often - so they too will be early version of the ongoing development. In other words, they will be cool, but will get substantially better over time.
OK, that’s about it, now we can turn to charts for the weekend.
Mega Cap Charts
We start with GOOGL, and first bring back the zoomed in image we shared last Friday with the comments we made:
Last week: The stock is on top of a congestion line which itself was formed by a quadruple bottom an then a triple top.
We zoom in for clarity; focus on the little circles on the pink line in the past and you will see the quadruple bottom and then a triple top following it.
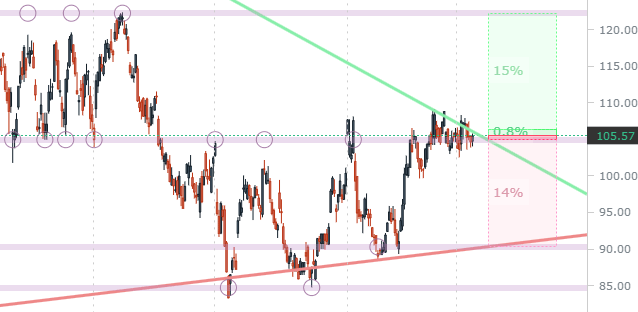
This chart implied that a change was coming to GOOGL and we definitely got it with news from their I/O conference.
Now look at the zoomed in image and then the 3-year chart from which it came:
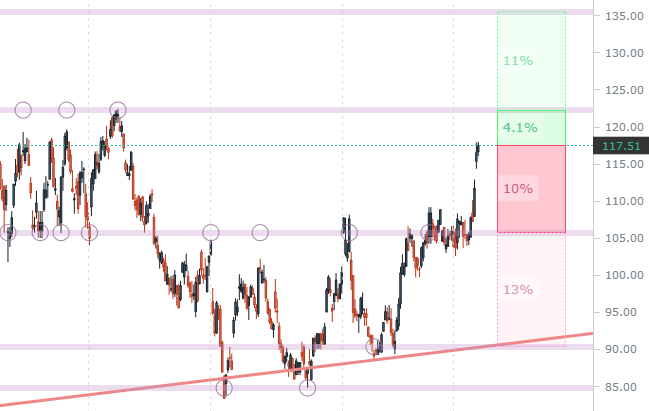
The stock roared into the upside PnL zone and gobbled up most of it.
Here is the 3-year chart for context:
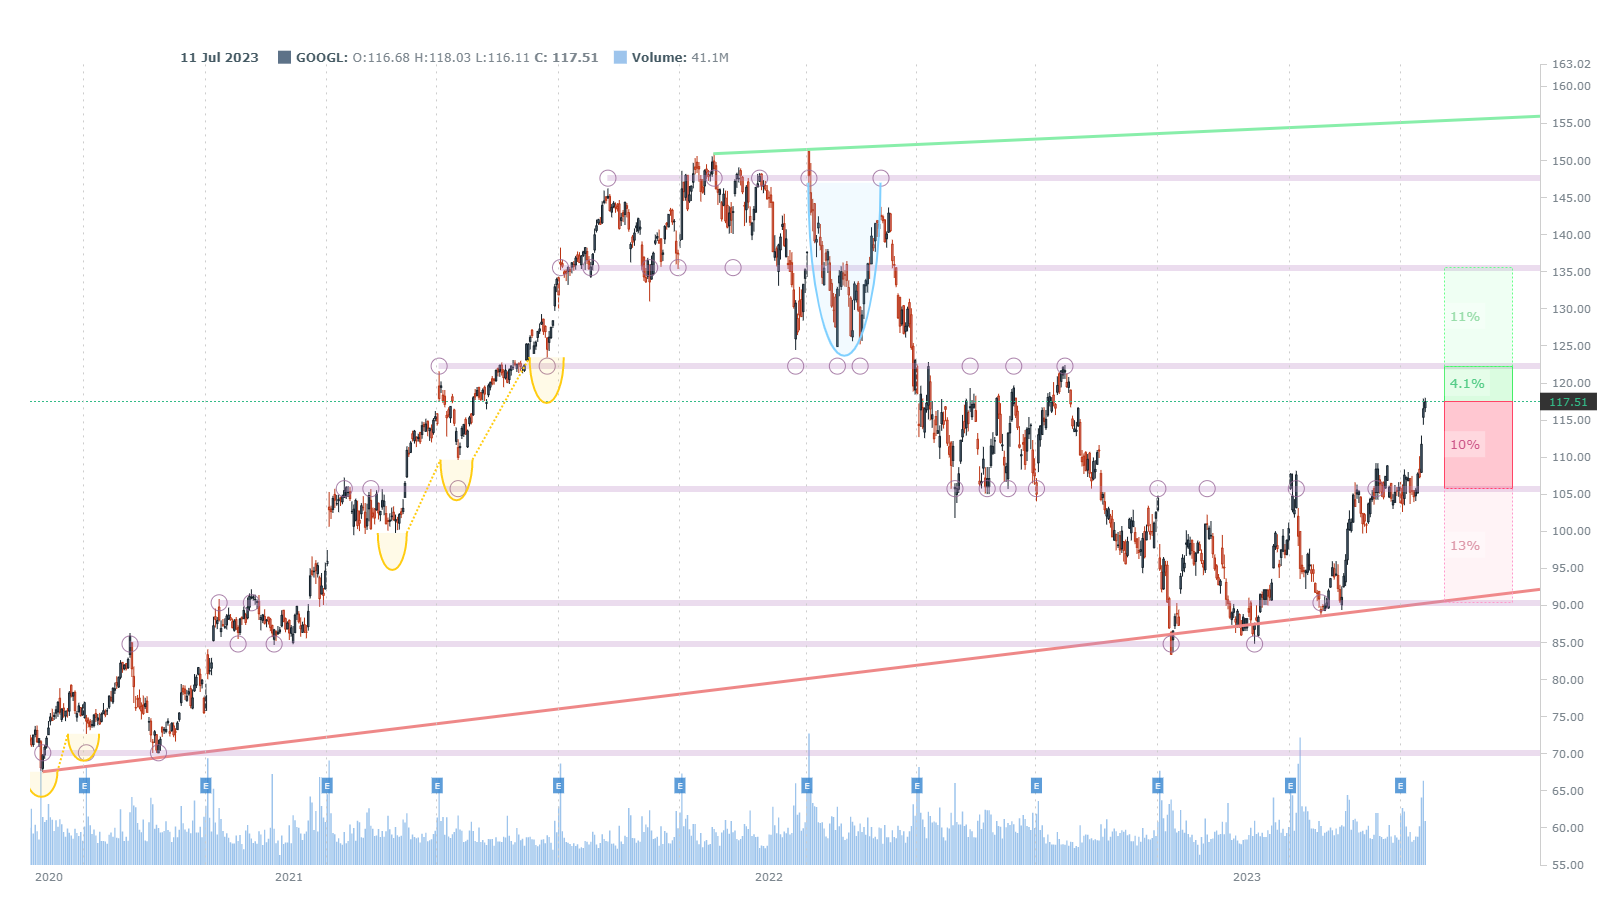
GOOGL will either get back to that triple top and break into a new paradigm higher, eyeing $135, or that same triple top will end this short-term rally.
AMZN had a similar week to the upside. We bring that chart from last week back as well as our commentary.
Last week we wrote this:
Last week: We zoom in and see that for a trader with a quick exit, there is a bit of a risk to reward benefit:
And as the probabilities would have it, we now see AMZN now about 5% higher:
Here is the 3-year chart for context:

AMZN has realized the short-term upside reward:risk bullish set-up and rests very much in a situation where it will either breakthrough that trend resistance (green line) or fail back to congestion.
We also wrote about META and shared the following:
Last Week: We have been writing a fair amount about META as it walked up support but now it is right at the bottom of a prior gap and it will take quite the push to get it above:

Indeed META was exhausted from the prior large moves and that wall of resistance formed by the former gap down held. Here is the updated 3-year chart:

For now META will bounce in between that resistance zone and rising trend support.
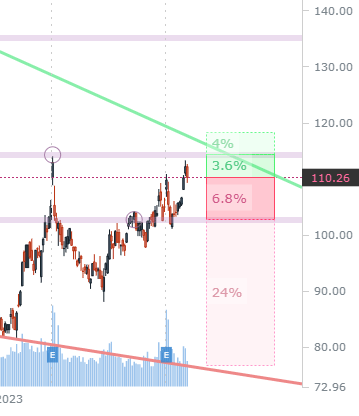
We discussed TSLA as well, and wrote the following last week:
Last WeeK: TSLA is in no man’s land, much like GOOGL, but this time with a recent down trend.
That downtrend is most easily seen by a trader through the downward sloping trend resistance line (the green line) reflecting a series of lower highs.
TSLA closed last week at $170 and today it sits at $167 with a similar chart.
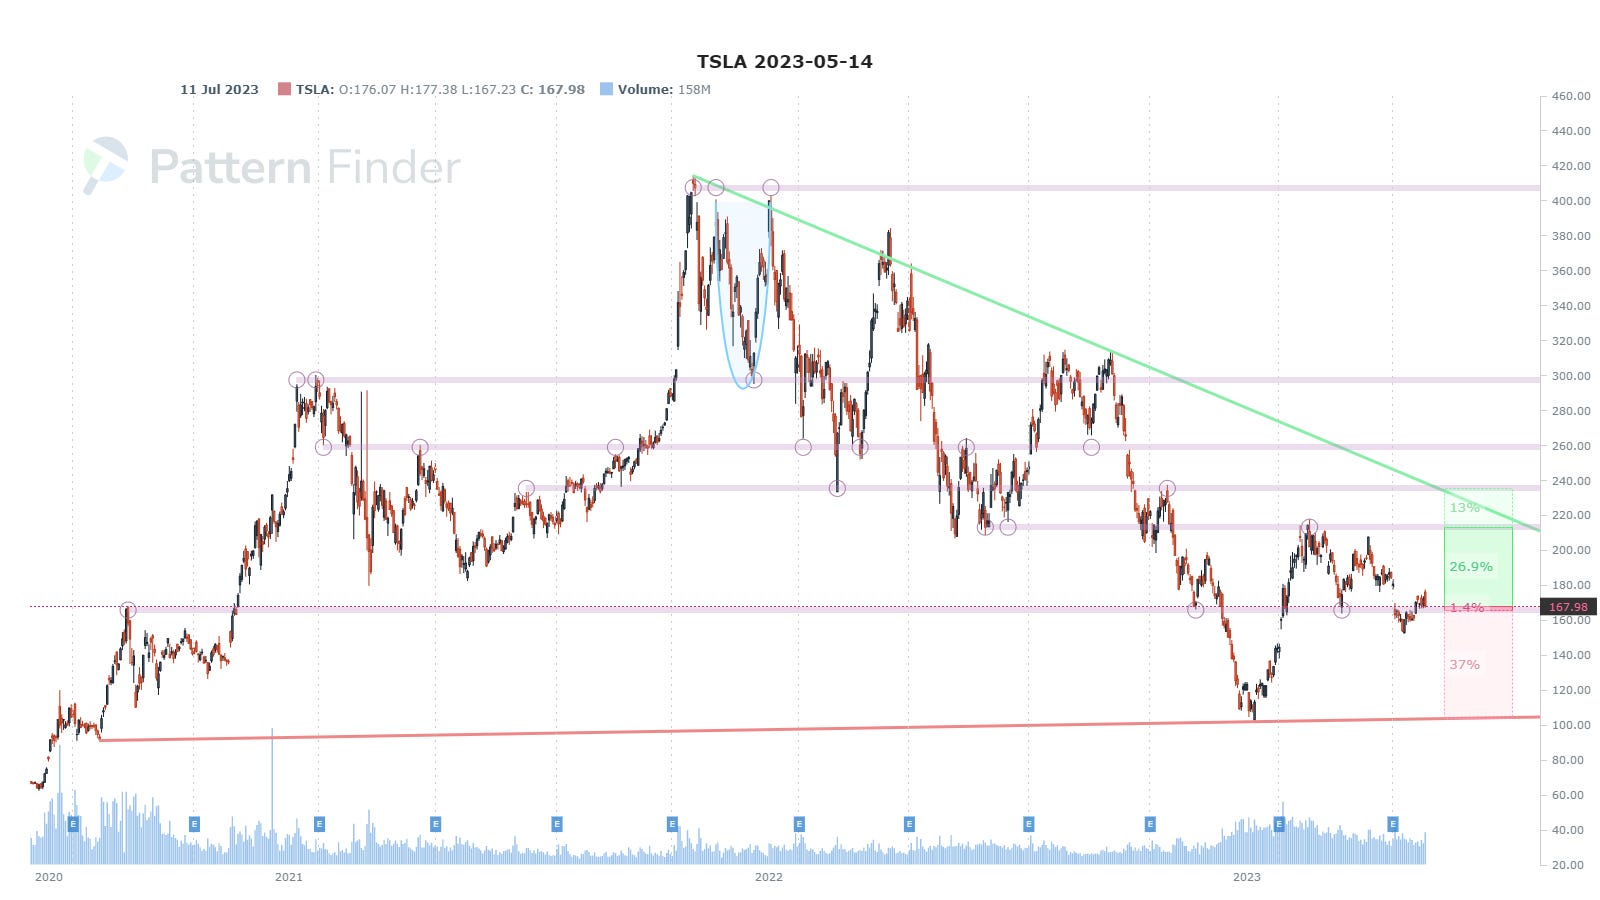
It’s a precarious situation with ammunition for both the bullish and bearish trader.
We zoom in for clarity:
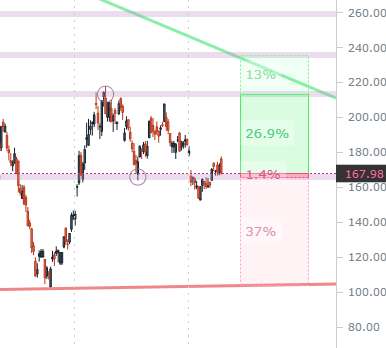
If TSLA cannot hold it’s support at ~$165, there is a lot of room below, but, if it consolidates here, there is a lot of upside.
We wrote about AAPL as well last week with this:

Last Week: The chart reads that upside to the all-time high may follow through but above that would take quite the volume. It looks toppy.
One week later, that sentiment proved right. Here is both the 3-year chart and a zoomed in look.
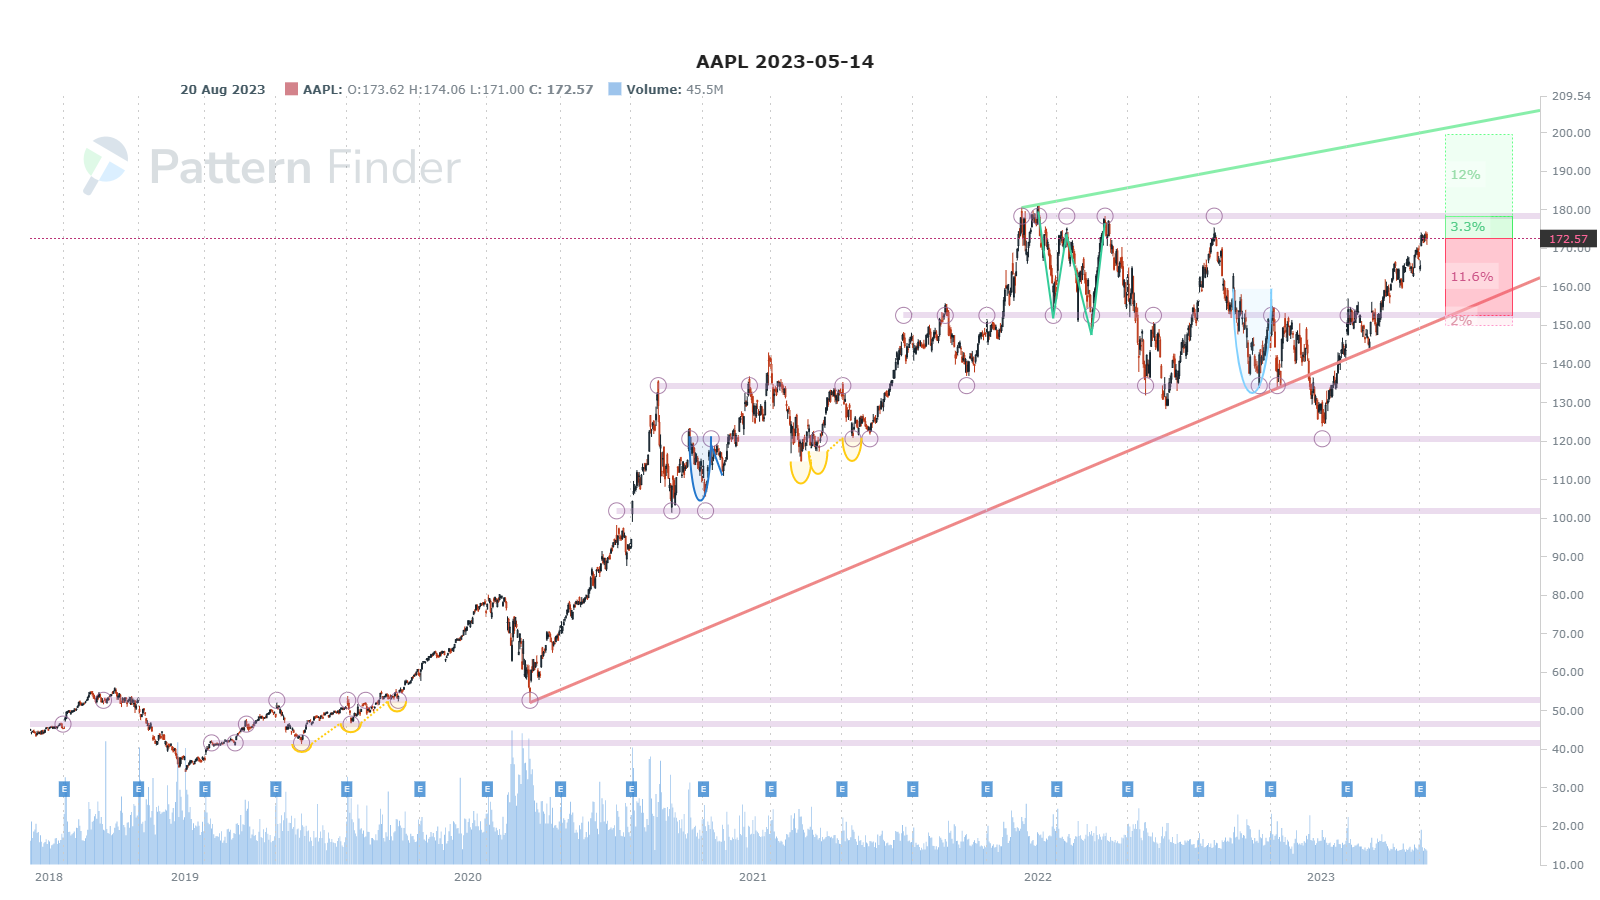

AAPL has had a great up trend but it still looks toppy. It will take some strong news to move it higher.
Conclusion
You can do this yourself inside Pattern Finder; it takes about 3 seconds per chart, if that.
We are offering a huge discount and some demo videos to explain the capabilities, below.
Pattern Finder: The Next Era of Charting.
And ChatGPT driven AI is coming soon to Pattern Finder.
We take a thrilling leap forward in AI innovation by unveiling a pioneering ChatGPT-driven tool for economic, financial, and stock chart data analysis, seamlessly integrated with real-time statistics.
This groundbreaking achievement unites the prowess of AI and up-to-the-minute data for the very first time.
To date, ChatGPT is extremely limited for use cases requiring current data, because ChatGPT’s “learning” is currently based on information with a hard data cutoff at September 2021.
There has been no meaningful way to effectively use ChatGPT or other powerful new AI tools for market and financial analysis.
That barrier has been broken and soon we will serve up insights unlike anything previously available, even through professional terminals that cost thousands of dollars to use.
The price of Pattern Finder will rise substantially once we introduce this new capability.
Please do feel free to join us:
Pattern Finder: The Next Era of Charting.
Thanks for reading and sharing is appreciated as well!