


Charts: The Market, Mega Caps, Strength in These Industries


Lede
Today we’ll start with the SPX, then turn to the mega caps that have reported earnings (MSFT, GOOGL, META).
Finally, we’ll point out areas of strength in the market.
Preface
As a reminder, Pattern Finder is now live — in general availability. Since this is the first week of release it is deeply discounted (like… deeply).
At the conclusion of this post, we share some videos and a link to learn more as well as a deeply discounted offer that will end soon.
The Market
We will follow our more rigorous review of charts; long-, medium-, and short-term.
Here is a 10-year chart of SPX, using monthly candles. The trend resistance (green line), trend support (red line), and congestion lines (purple transparent lines) are all automatically drawn by Pattern Finder (that’s the point!).
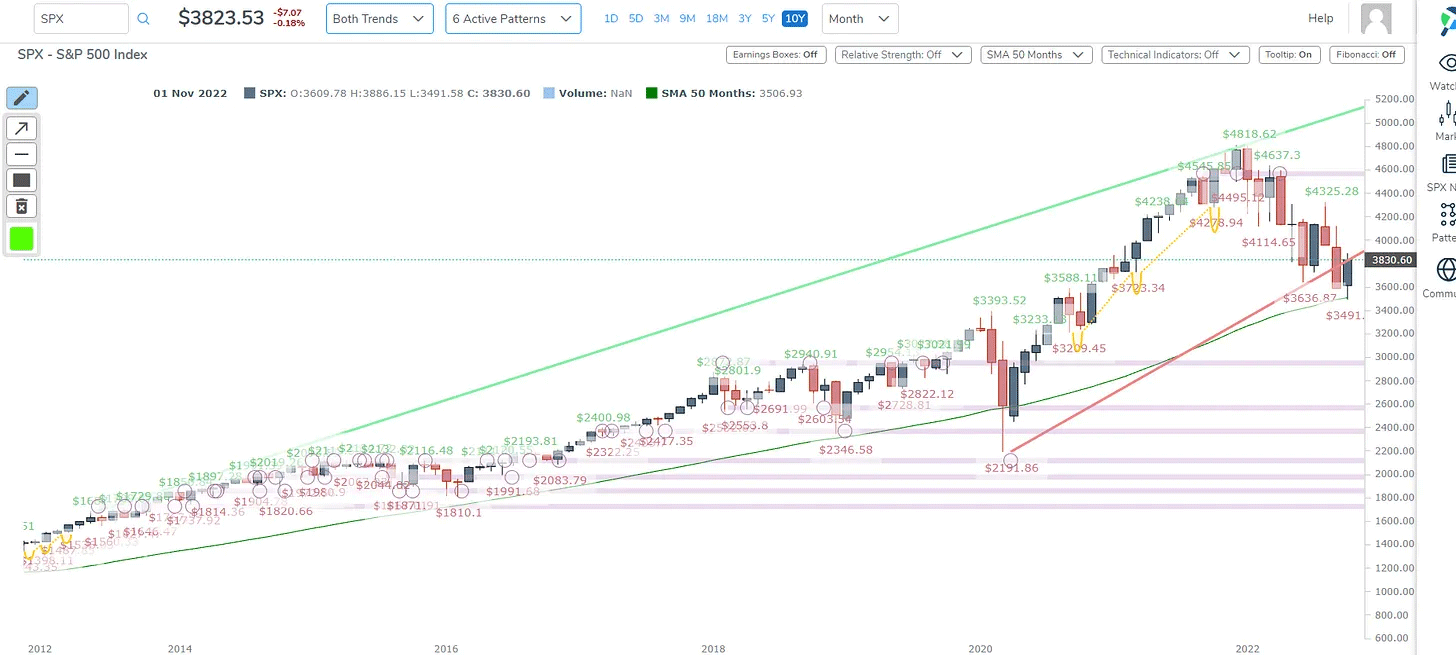
We have also enabled the 50-month SMA (simple moving average), that dark green curve and we can see that SPX is at critical support levels and if it does not hold there is a lot of rom beneath it to the next congestion line (pink line).
That’s the long-term chart.
Next, the medium-term chart; 3-years, using daily candles (and therefore the 50-day SMA).

We see essentially the same picture on the medium-term chart — this is just a crucial time for the index as we go into earnings. On this medium-term chart we see a possible support at 3500.
Finally, the short-term chart; in this case 18-months (daily candles), but 9-months (daily candles) or even 3-months (hourly candles) can be used. It’s a matter of preference.

It’s easier to see the coincidence of the 50-day SMA (the dark green curve) with the current index level and a long could use the near-term congestion line of ~3700 as a stop, and a profit zone of ~4100.
(I drew in the two boxes to measure the risk:return profile of a short-term trade with Pattern Finder’s drawing tools.)
The market is in a precarious position, with the 50-week and 50-day SMAs touched.
Mega Caps
We’ll follow the same cadence here: long-, medium-, and/or short-term and then conclusions and trading ranges.
We’ll start with the weakest charts, META, and the 10-year using monthly candles.

Of all the mega cap charts in tech, this is the weakest. META is through multi-year support, below the COVID lows, and its next support would be ~$85 if these very early day losses hold.
The 18-month chart shows that META is at short-term support as of right now:
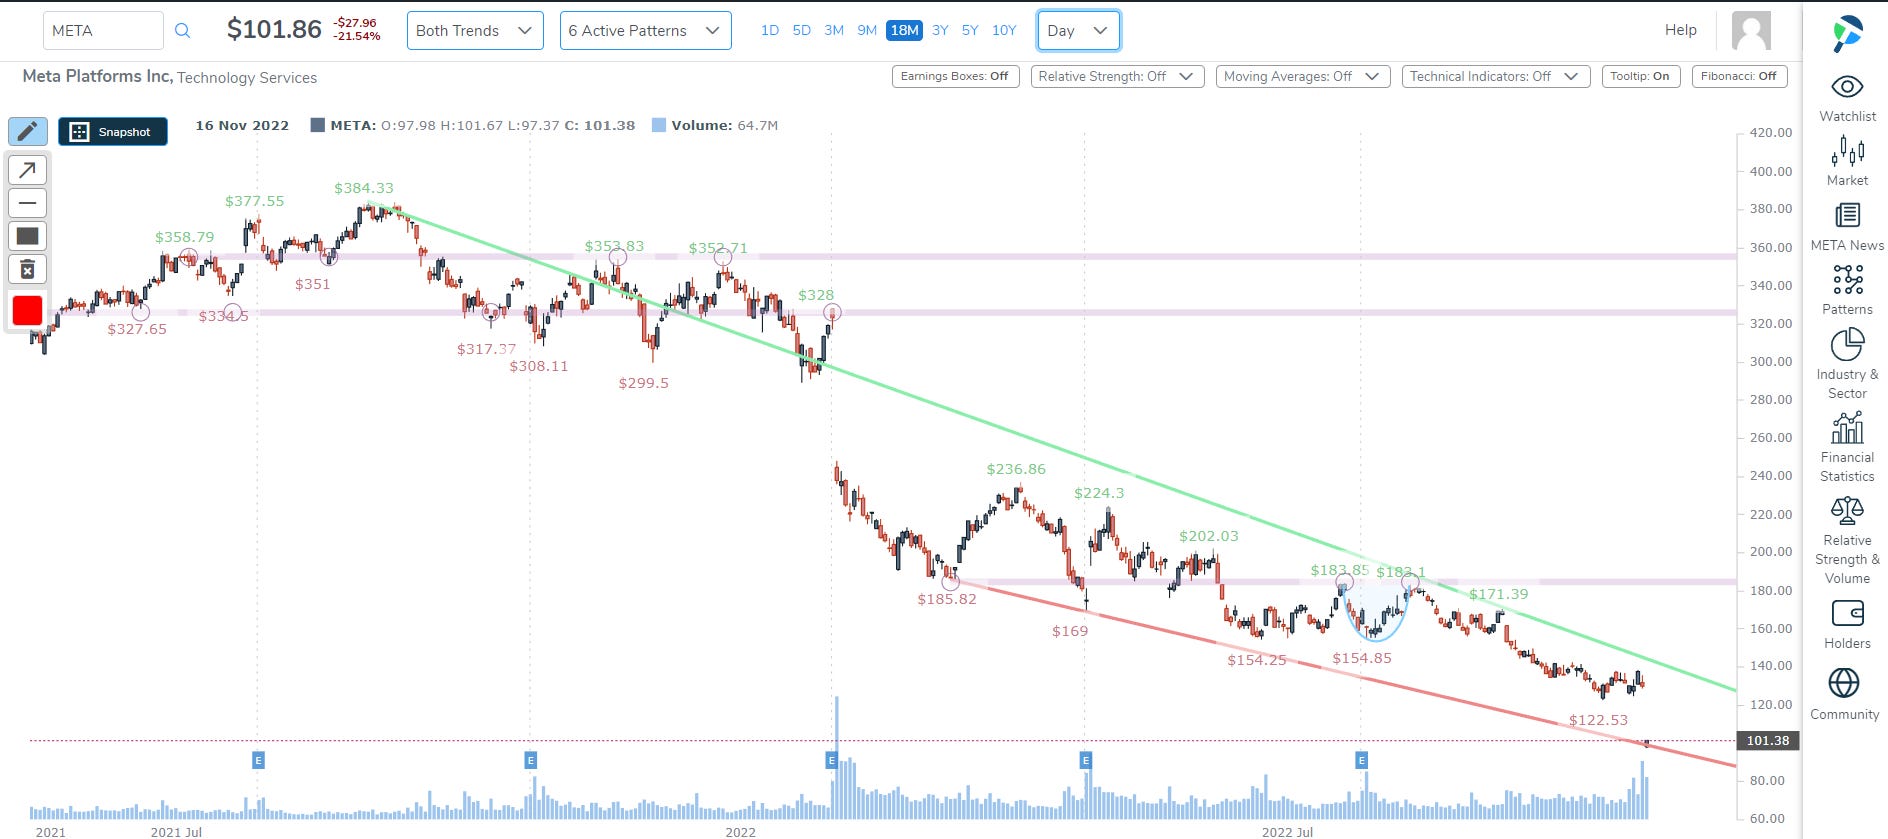
See that last candle in the gap down — that’s actually touching the 18-month support line.
A bold swing here would get long at this level (if it holds), use the down trending resistance (the green line) as the profit zone which is ~$125, and would have to go back to a longer-term chart to find a stop. But… trading to strength is my preference and this isn’t strength.
This is the weakest chart we see. Now we can turn to GOOGL and again start with a 10-year monthly chart:

GOOGL is through long-term support, and was even before its earnings print. The long-term congestion lines all way down below $70 reflect the unfettered gains after the COVID lows. The closest support in is the congestion line (pink line) is right here.
This is a common theme in mega tech — a lot of downside space after the massive run post COVID, with the criticality of stopping the bleeding right about at current levels.
The 3-year chart (daily candles) shows that perhaps the next resistance for GOOGL could be at the ~$85 level if we lean on prior congestion lines.

And finally, MSFT; starting with the 10-year (monthly candles):

The high correlation continues here — with MSFT’s chart essentially being a copy of GOOGL’s as are the comments.
Even before the earnings release this week, MSFT was below long-term support and there is a long way down if shorter-term support doesn’t hold, which we will look at in the 18-month daily chart:
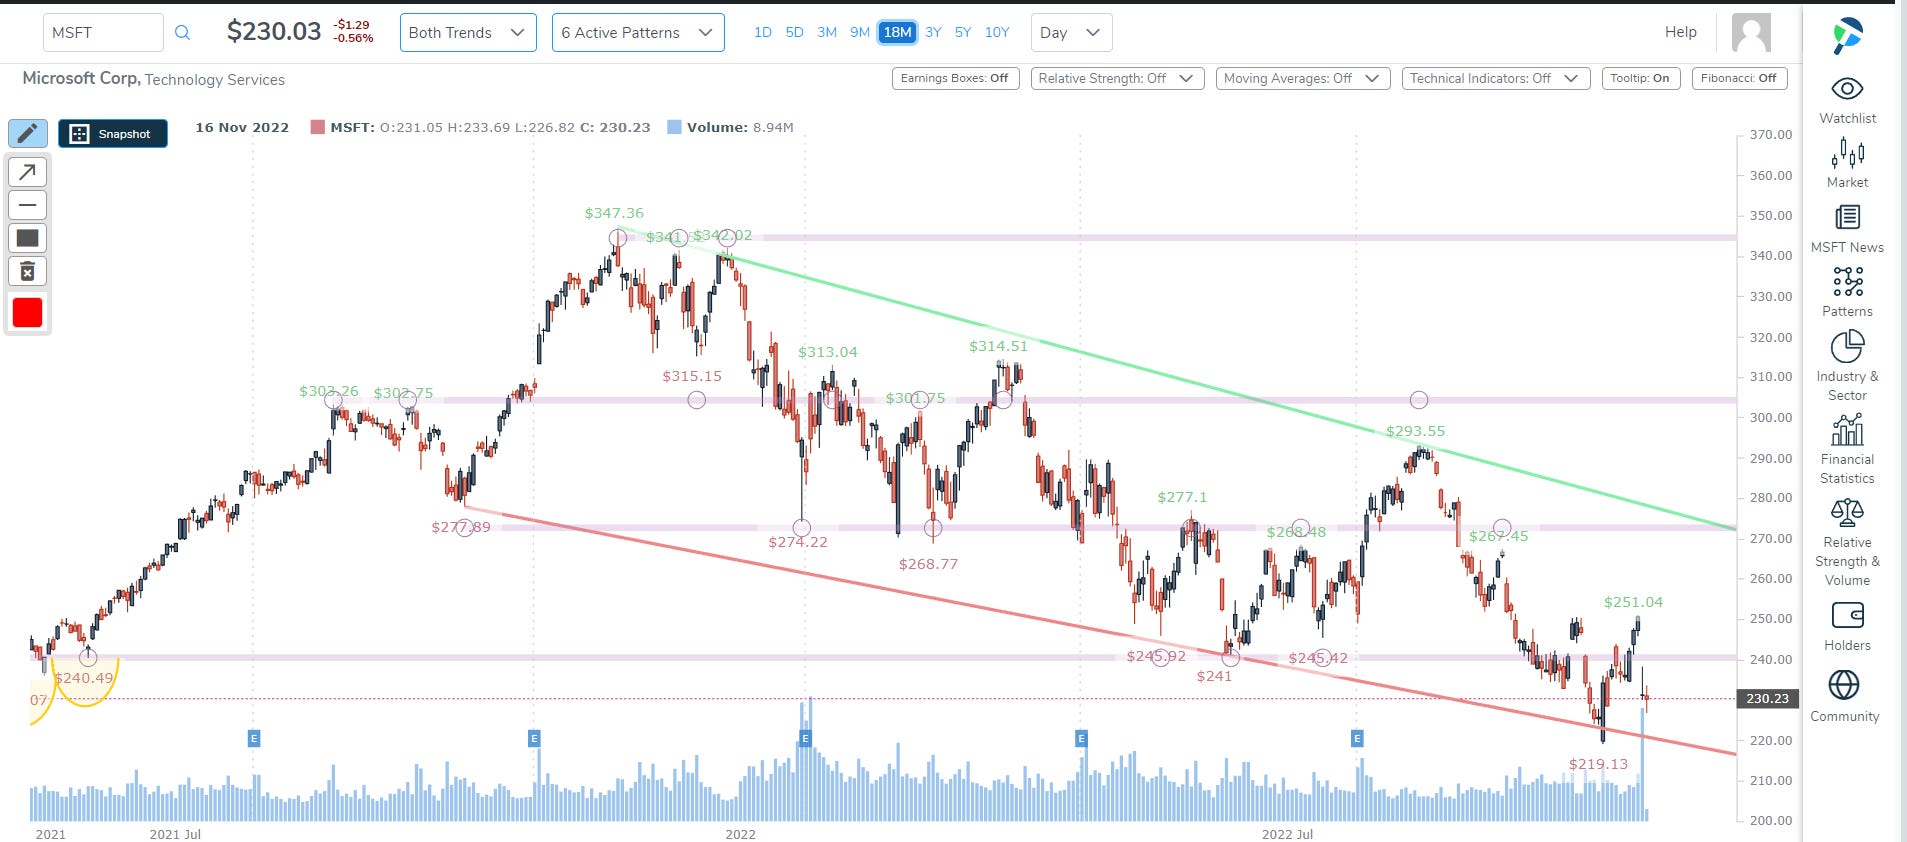
The short-term chart suggests perhaps MSFT does have support at ~$220, and any kind of reversal would only be convincing above the recent congesting line (~$240).
OK, I hope that was informative and instructive! Next, away from weakness and into strength:
Strength Is…?
We run a screen for companies with strength, not just short- and long-term relative strength (RS), but also using our proprietary fundamental rating (‘EPS Rating’) and our proprietary buying strength rating (‘Buy Sell Rating’).
Here is the screen and the number of companies that qualify:
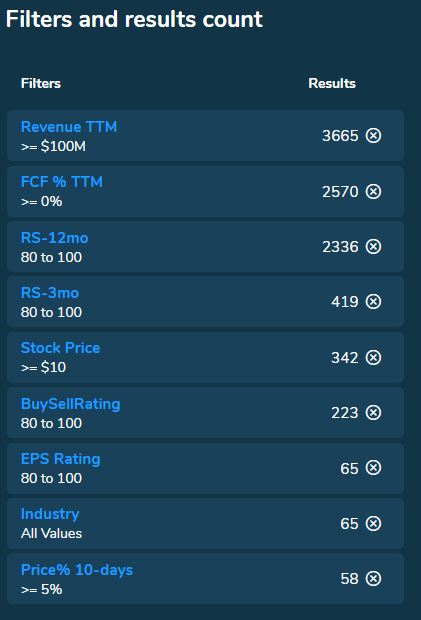
In this case we use both our proprietary EPS rating (a proxy for fundamental strength) and our Buy Sell Rating (a proxy for buying strength.)
If we do a quick analysis by sector (copy and paste into Excel), we see the overwhelming strength is in two sectors (the market has 12 twelve sectors per Factset classification) and really, it’s two industries in the ‘Energy Minerals’ sector (integrated oil, oil and gas production) and one sector in ‘Finance’ (regional banks).
If you’re looking for strength in fundamentals, 3- and 12-month RS, and buying strength, you’ve got your focus industries.
We can pluck out some results.
ROCC (Oil And Gas Production) is our first, and we start with the 10-year chart (monthly candles):
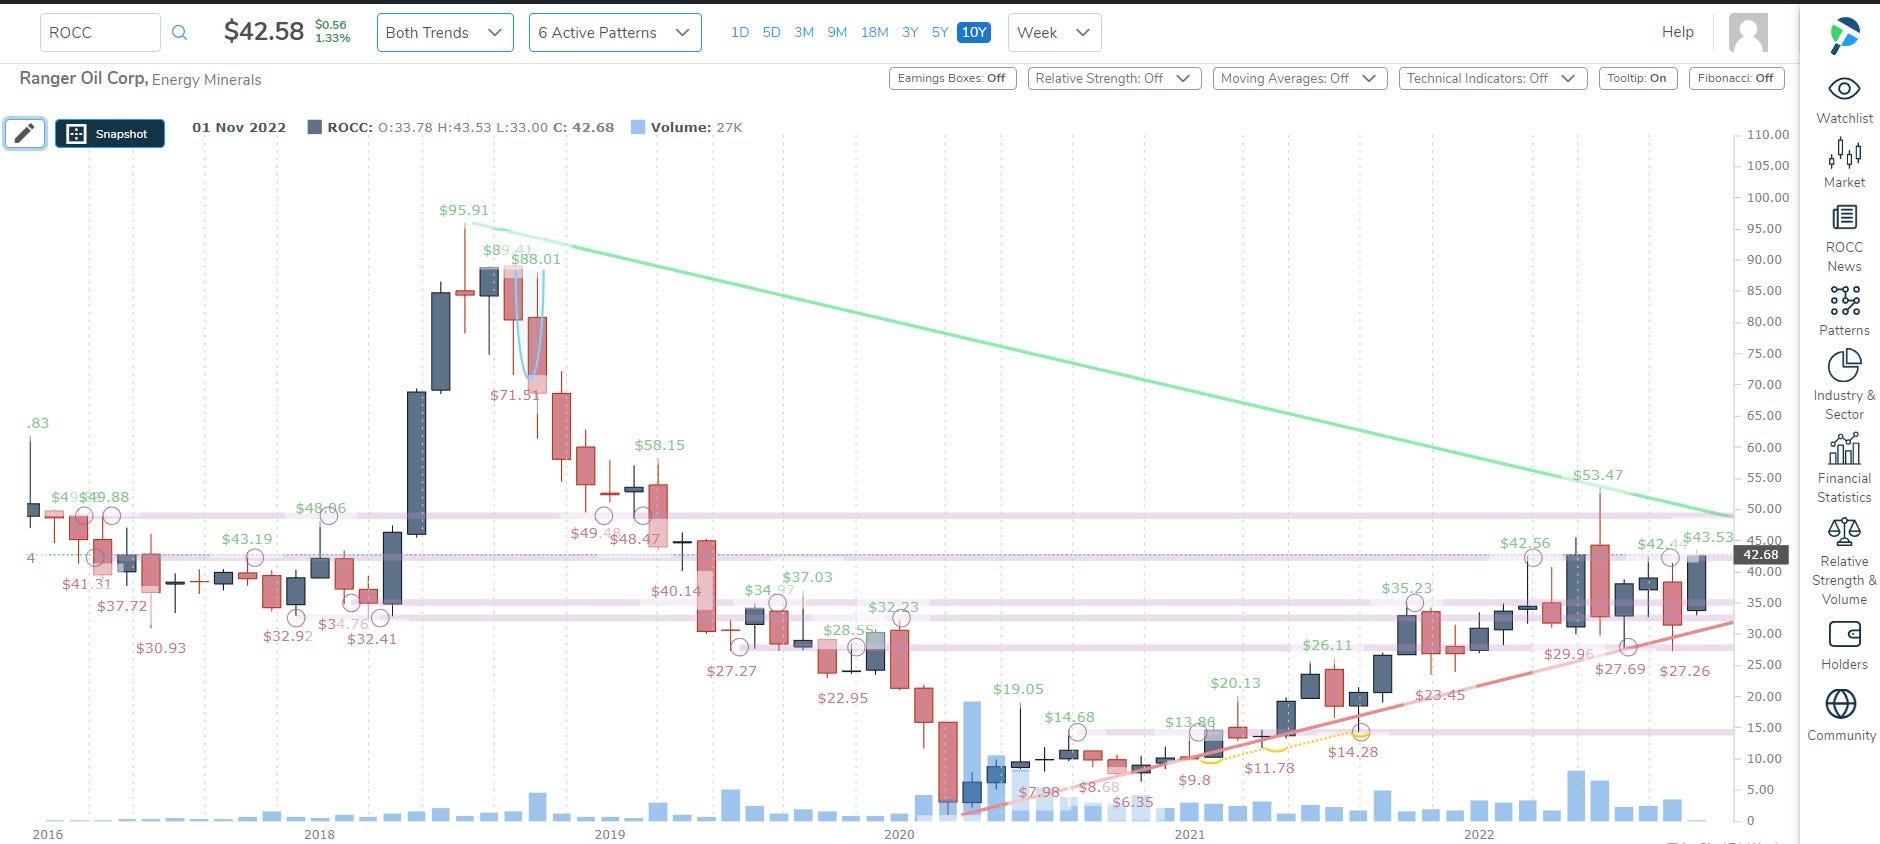
We see a nice base formed by several congestion lines in the $25 - $35 area, with the stock now at the next congestion line (stock is $42 currently).
The medium-term chart shows us some clearer pivot points (3-yr, daily candles):

The same congestion point at about $42 is there, but if the stock breaks above, this is a pretty good looking chart with that prior multi-year eye as a reasonable stretch target and the congestion line as a tight stop.
Substack (the platform this is written on) limits the length of these posts so I’ll have to stop here.
For Pattern Finder members, you can create the screen as prescribed above and save it to a watchlist, then go ticker by ticker to find your spots.
For non-Pattern Finder members, come on and join us - we’d loved to have you learn more about Patten Finder and get your feedback in Community as you peruse the list to do your own charting magic.
I have included a snippet of the screen results for you:

Conclusion
Patten Finder is a charting and technical platform with robust screening for fundamentals, growth, RS, buying intensity, volume, and a much more.
You can learn more on the page below, which includes two short videos (one for patterns and one for screening) and very large discount for the first week.
We also have a charting webinar this Saturday.
Above all else, we will discuss why technical analysis or charting can be predictive of future stock returns - the implicit assumptions made in that statement, which are two fold, and span both the broad market indices, and down to a single stock.
Then we will apply this reality to trading, specifically and explicitly -- identifying strength not just today, but how to identify strength at any time.
Thanks for reading, friends.