


Direction Signals are Mixed; But This Signal is Strong

Lede
There are profits to be had.
Preface
The equal weighted S&P 500 has turned decidedly down in the last week as the glow from a “not that bad” earnings season together with the hope that the Fed will “chill out” has become dimmer.
This can be seen well in the chart for RSP (equal weighted S&P 500 ETF):

Ah, market cycles…
… Optimism may well return in a few weeks as earnings come back around, but for now, charts look pretty choppy.
That, it turns out, is the perfect time for a signal we have used for several years.
Off we go.
The Dimming Glow is a Signal
One of my favorite option trades is a short-term speculation on a volatility burst for individual stocks that meet specific criteria as outlined in TradeMachine.
The strategy itself, once the technical conditions are met, is rather simple: going long a slightly out of the money call and put (a “strangle”).
We have a 4 minute video that discusses the dynamics in TradeMachine.
As we will introduce on our webinar on June 29th (free to join for anyone), if we systematically incorporate return distribution dynamics in the triggers, the results improve markedly.
In this case, when we look at the NASDAQ 100, employing the technical trigger over the last year has delivered a 51% win rate, which in and of itself is rather remarkable considering that generally blindly owning options is a losing strategy, so there is something here.
But… when we add two more requirements looking at a type of skew (distribution asymmetry) and kurtosis (tail behavior), the win rate rises to 57%.
And, for those of us who are statistically motivated, the p-value of a binomial test on the significance of the difference between those two numbers (51% vs 57% win rates) is 0.069.
In academic settings, statistical significance is generally recognized with a p-value below 0.05, but in the real word of finance, that’s quite unusual, and a p-value of 0.069 is quite good.
That’s techno-speak to say that the probability that we would see this data with these two win rates (51% and 57%) and that there is in fact no difference between them (that it’s random luck), is just 6.9%.
And, using these return dynamics has shown greater than 99.99% statistical confidence for stock trades as well as over 98% confidence for various other option trades, like our famed pre-earnings optimism call calendar:

And by famed, we mean publicly read by the largest institutions in the world.
And how can we demonstrate the veracity of that claim in a way that we are allowed to reveal?
Ah, anything that is public, like the public disclosure readership of our TradeMachine pre-earnings momentum research posted to LinkedIn more than 5-years ago:


Alright, now on to the triggers today and the impact on stock returns as well, even without options.
Combining TradeMachine with Pattern Finder is our preferred method, so we start with the “Today Tab” in TradeMachine for the days triggers on this strategy:
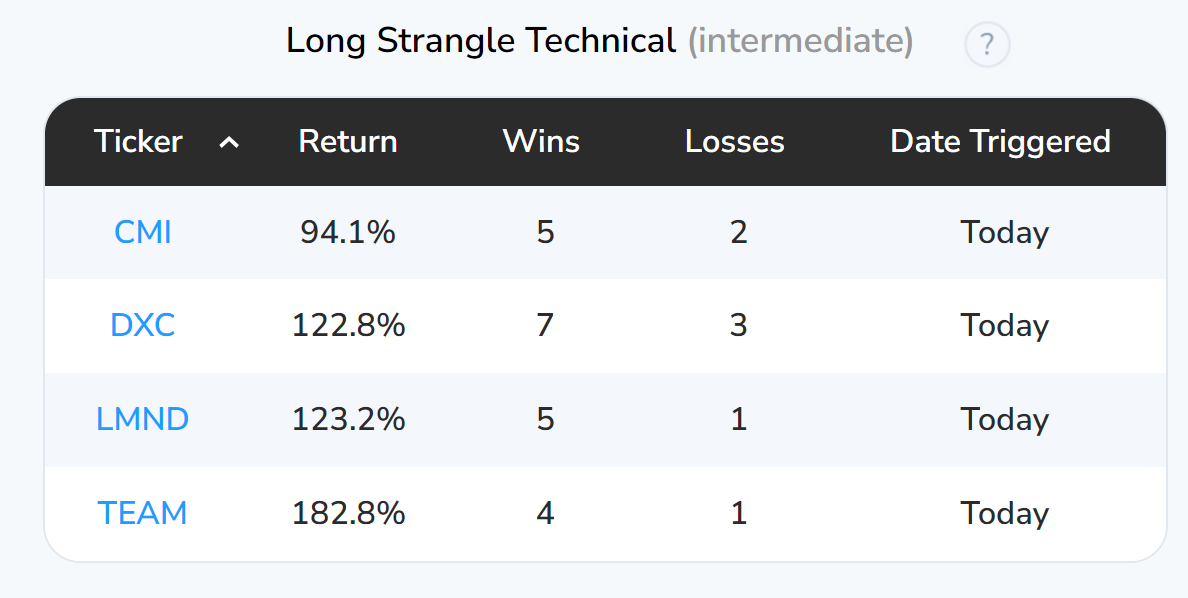
In the up trending market of late, there have been few triggers, but today, as TradeMachine ingests the recent sell-off, triggers are appearing.
Let’s look at two of them, starting with ticker LMND.
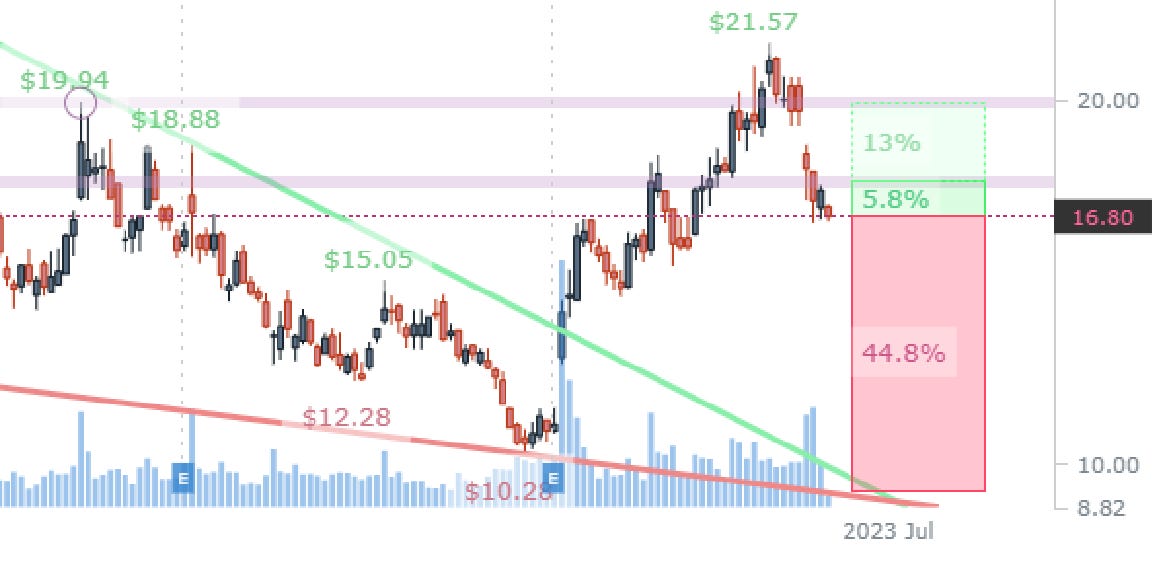
We start with a chart from Pattern Finder and all of the algorithms turned on so we can have the chart marked up for us instantly:

It’s not hard to see the accuracy of Pattern Finder’s algorithm, which ahead of time recognized the ~$20 area as congestion.
We zoom in:
And with that chart in hand, we can turn to the backtest results that we are fed by TradeMachine over three-years for LMND:
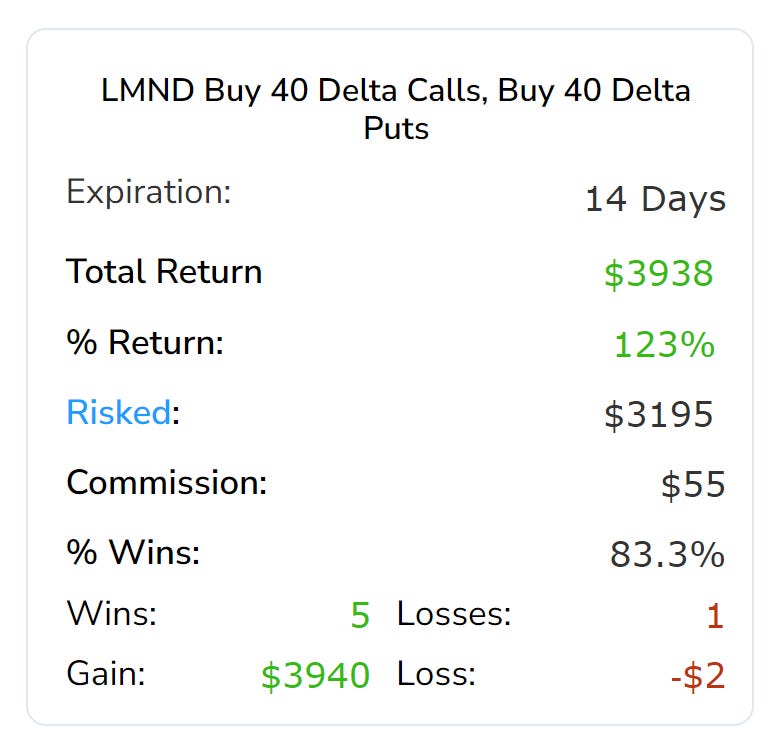
We see strong historical results, and today is a trigger again.
Next we turn to software powerhouse TEAM.
Here is the chart from Pattern Finder. You will note the similar recent dip that we saw in LMND.

Pattern Finder’s algorithm noted that congestion at ~$190 well before the downturn, reinforced by the top of a prior cup. We zoom in:

And with the chart in hand, we can turn to the results from TradeMachine:

This is another solid performer over the last three-years.
OK, there is a lot more we will say about these returns distribution dynamics and how they impact several option strategies and stock returns:
Buying options (like these strangles)
Selling options (like short put spreads)
Pre-earnings momentum call spreads
Simply straight down the middle owning stock
As a teaser, here are the results of our proprietary computations and filters applied to a generic short put spread: check out the win rates and the average trade return as well as the statistical significance of the win rate.

There is window here.
We will demonstrate all of this is great detail in the upcoming webinar.
Conclusion
Discovering an aberration in finance is quite hard, and there are thousands of intelligent people that will go to the grave backing the idea that it is a fool’s errand; it’s just not possible and the efficient market hypothesis is the only truth.
I have found an aberration before, presented it on the main stage of the CFA Institute in the UK in 2019, had the work published in an academic journal, and ran a hedge fund using it with great success until the algorithm was purchased by Morgan Stanley Capital International (MSCI).
I believe we have found a second aberration - the second of my 25-year career in professional finance.
All are welcome to join the webinar and observe, critique, and if it moves you, to participate in making use of it.
But, there’s one “gotcha.”
Once we make this data available in Pattern Finder for screens, and in TradeMachine for historical backtesting, the price of both products will go up.
Early internal indications are that the prices will rise 100% - 200% (so a double or triple of price).
But, until we demonstrate the results formally (on the webinar on June 29th), we are keeping the price the same and anyone that subscribes before hand will maintain their discounted price for as long as they remain an active member and we offer the data.
We also note that these are monthly subscriptions, so anyone can cancel at anytime without even reaching out to support - just go to your accounts tab and cancel.
You can learn more about Pattern Finder and secure the low price here.
You can learn more about TradeMachine and secure the low price here.
Have a fabulous weekend, friends.
Legal
The information contained on this site is provided for general informational purposes, as a convenience to the readers. The materials are not a substitute for obtaining professional advice from a qualified person, firm or corporation. Consult the appropriate professional advisor for more complete and current information. Capital Market Laboratories (“The Company”) does not engage in rendering any legal or professional services by placing these general informational materials on this website.
The Company specifically disclaims any liability, whether based in contract, tort, strict liability or otherwise, for any direct, indirect, incidental, consequential, or special damages arising out of or in any way connected with access to or use of the site, even if I have been advised of the possibility of such damages, including liability in connection with mistakes or omissions in, or delays in transmission of, information to or from the user, interruptions in telecommunications connections to the site or viruses.
The Company makes no representations or warranties about the accuracy or completeness of the information contained on this website. Any links provided to other server sites are offered as a matter of convenience and in no way are meant to imply that The Company endorses, sponsors, promotes or is affiliated with the owners of or participants in those sites, or endorse any information contained on those sites, unless expressly stated.