Finding the Best of the Best: Two Breakouts, Defense Stocks, and a Pitfall... Corrected
Lede
Today we use the ‘Pattern Breakouts’ tab to find strength in a restaurant stock and learn about trending relative strength (RS) and buying strength, then purposefully look at strong defense stocks but illustrate what we… don’t want to see.
We then put it all together to find what we are looking for and share that breakout.
Breakout Through Resistance
We start today with a stock that has recently broken through both its 18-month and 3-year trend resistance through the ‘Pattern Breakouts’ Tab (remember this; it’s coming back):
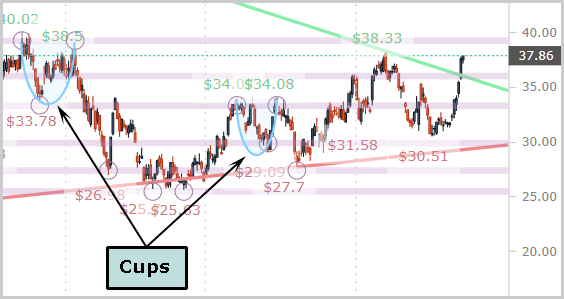
The 3-year chart is shared below. We see two cups that establish those congestion lines (pink lines). CAKE is through resistance (as we would expect given the tab we just used).
We can zoom in:
This is a good looking chart, but now it’s time to extend our analysis - to improve.
Using the RS & Volume tab on the side Pattern Finder we get more detailed in our analysis.
Here is what we see for CAKE. Versus the industry, the 3-month RS is 83, well above the 12-month RS. This is what we want — ‘strengthening relative strength.’
Then we look outside the industry and again see RS stronger in the short-term,
We see the same and that CAKE is within 5% of a new 52-week high in RS.
And finally, it’s all about volume:
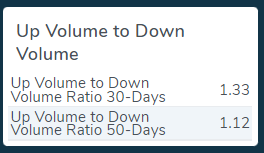
The up to down volume is 1.33 to 1 in the last 30-days and 1.12 to 1 in the last 50-days. That means we have ‘strengthening buying strength.’
Remember that data analysis, we’ll come back to it.
Screening for Defense
We next looked for strength in the strength of defense with a new screen:
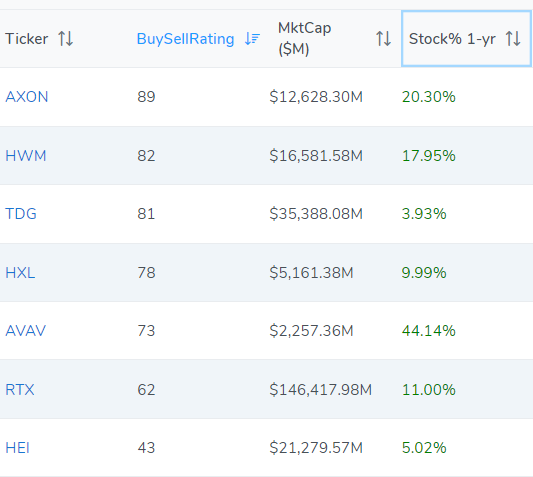
We get 7 out of 62 defense companies with these requirements:
We pluck out AVAV, which has the largest one-year stock return, turn to the chart and the (failed) analysis we introduced above:
The chart looks good enough for some to speculate. But we have a red flag:
The 3-month RS both in and out of industry is lower than the 12-month for both measures and we can see it easily enough by simply clicking the snapshot on the top of the chart. (Last time we did it with the RS & Volume Tab and simply share an alternative approach with the same data.)
We’ll let users peruse this list of seven.
Applying all of it - Breakout with RS and Buying Strength
We go back to the ‘Pattern Breakouts’ tab:
AA broke out two days ago. Here is the 3-year chart:
That’s a nice looking chart with a stop perhaps at the prior congestion (~$45) and limit profit zone at the next congestion line (~$57). Here we zoom in:
Ah, but we must repeat the RS and volume analysis and we do so by sharing the entire RS & Volume tab for AA:
AA has a higher 3-month RS within industry and overall than one-year while there has been stronger buying volume in the last 30-days than the last 50-days.
How about that…
Conclusion
We truly hope you are enjoying using Pattern Finder and our posts and see how easy it is to improve your trading and we hope you are learning as well.
Get Pattern Finder, join the trading community, and more, below:
Thanks for reading, friends.


