

Four Tech Darlings Ready to Break Out... or Break Down (SNOW, CRWD, DDOG, OKTA)
Four Tech Darlings Ready to Break Out... or Break Down (SNOW, CRWD, DDOG, OKTA)


Preface
Today we will look at one screen and four stocks — four tech darlings, each in various stages of trend support, all in a down trend, but some looking more likely to recover than others, should there be a relief really... finally.
Screen for the Darlings
We looked for the best of tech, before we turned to a chart by chart analysis.
Here’s the screen from Pattern Finder and the number of companies that qualified by metric.
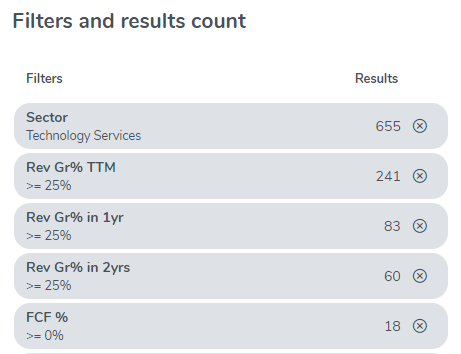
We’re looking at tech companies that grew revenue by at least 25% in the trailing twelve months, and the mean estimate for revenue growth in both one- and two-years forward is also at least 25%.
We added a final requirement for positive free cash flow (FCF) and went from 655 companies down to 18.
We then plucked the one with the the strongest 3-month relative strength (RS) (SNOW), the lowest RS (OKTA), and two more that were in the middle (CRWD, DDOG).
Off we go with chart analysis.
SNOW
Snowflake (SNOW) has the strongest three-month RS of the bunch. Given how badly tech peers have done over that period, this still isn’t a strong stock performance, it’s just relatively strong.
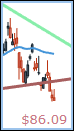
He’s the stock chart.
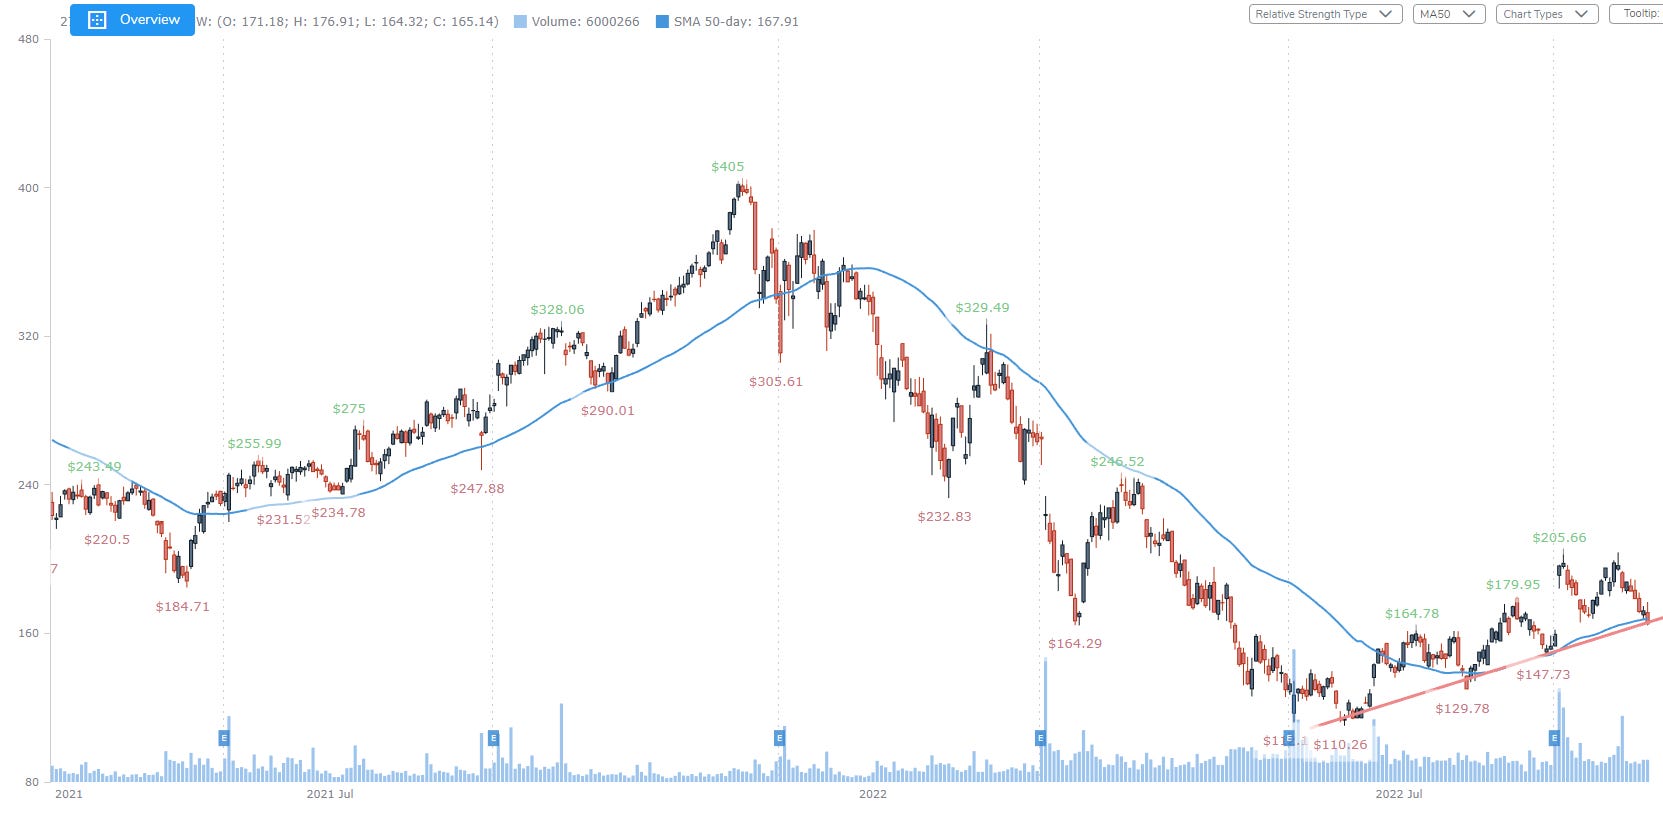
In this case we’ve only asked Pattern Finder to show us the trend support line with the 50-day simple moving average (SMA).
SNOW has shown higher lows off the June lows and that has built an algorithmically pleasing pattern for Pattern Finder to draw in support (it’s automatic).
But as is often the case with technical analysis, if two indictors converge, the signal may be stronger, and in this case we have the 50-day SMA (the blue line) running right into the trend support line (the red line).
The title of the post is “Tech Darlings Ready to Break Out... or Break Down” and that fits SNOW.
With SNOW’s extraordinarily strong 3-month RS to peers (96 out of 100), if even a short-term rally starts, SNOW has outperformed in the very recent history.
OKTA
Okta (OKTA) has the weakest three-month RS of the bunch. Given how badly tech peers have done over that period, this is not just relatively poor performance it’s downright awful.
He’s the stock chart.
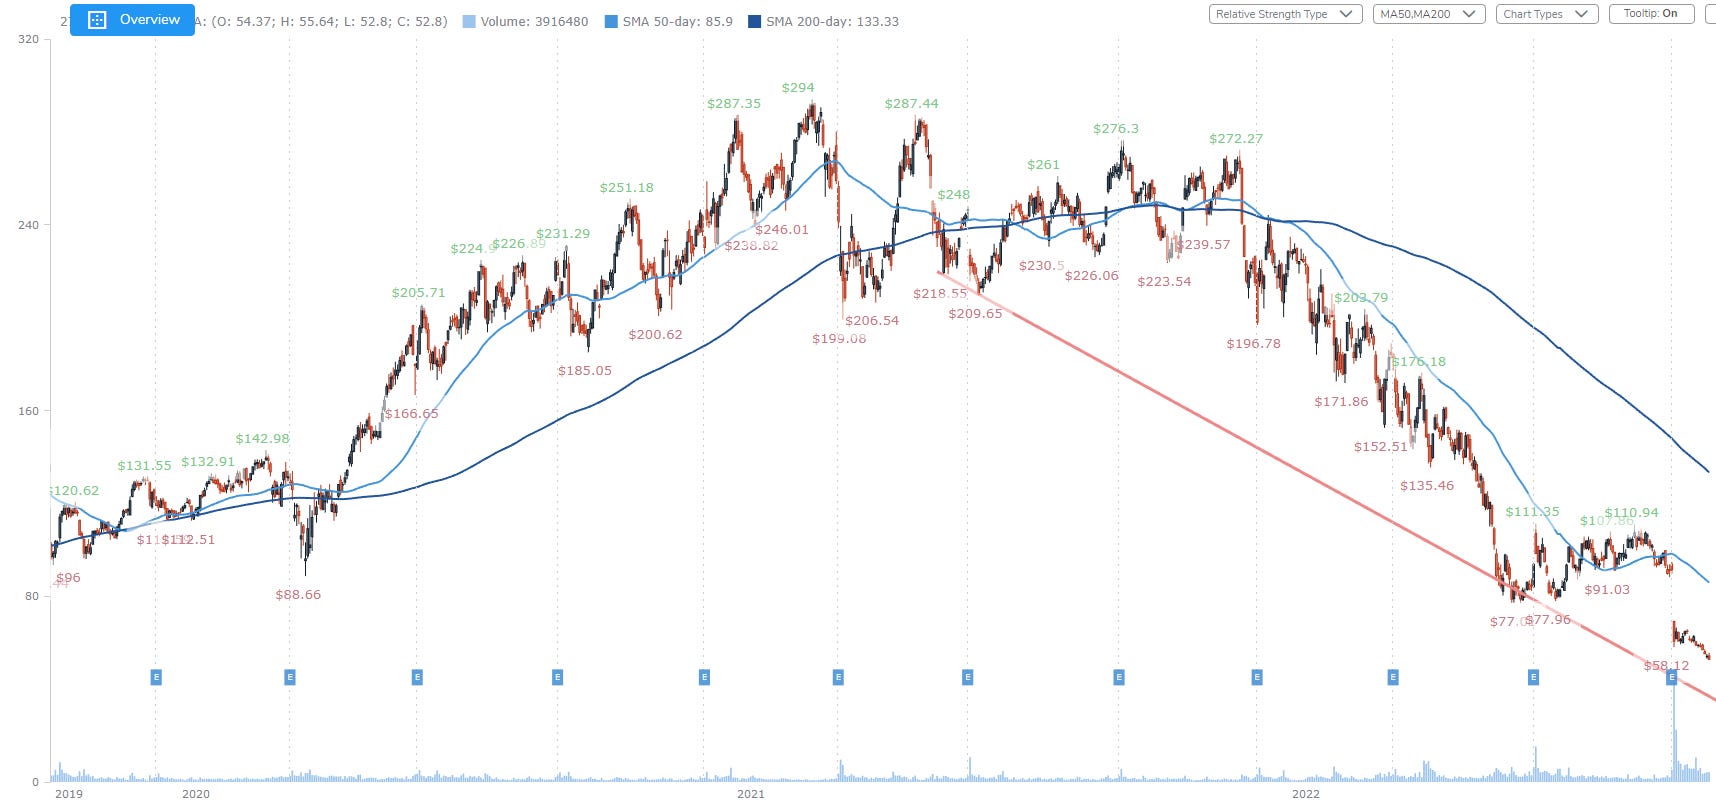
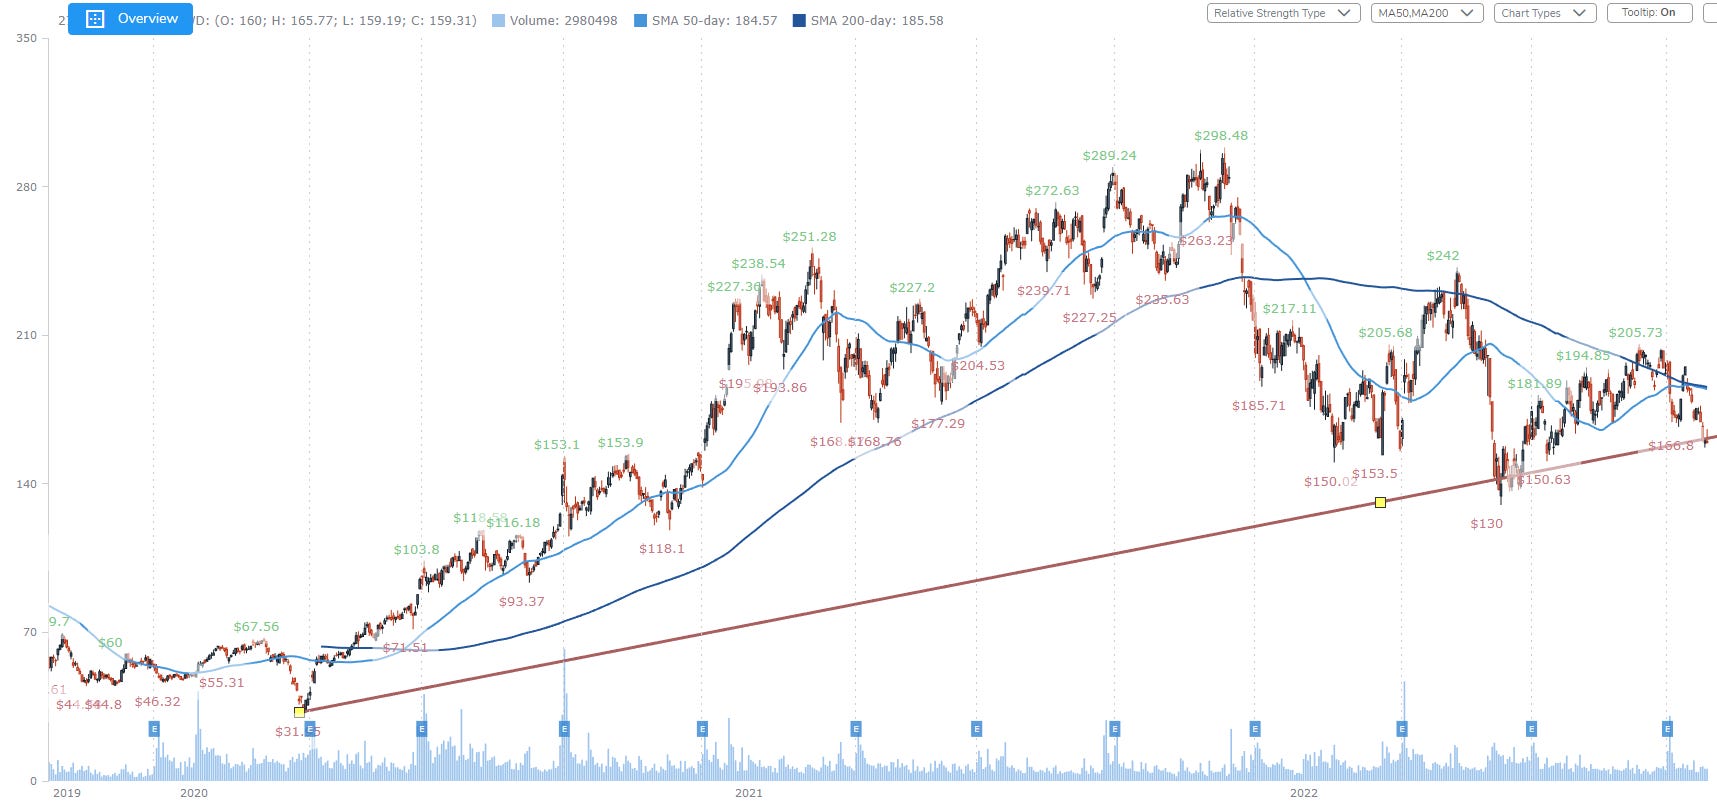
In this case the trend support line that Pattern Finder identified started at the May 2021 low and passed through the recent May 2022 low.
The 50- and 200-day SMAs are drawn in, but nothing more than context, as OKTA is in full blown technical failure.
The trend support as of today rests at a far lower price than even the current low.
We can turn to the pivot point chart for OKTA for a different view of the same phenomenon (also in Pattern Finder).
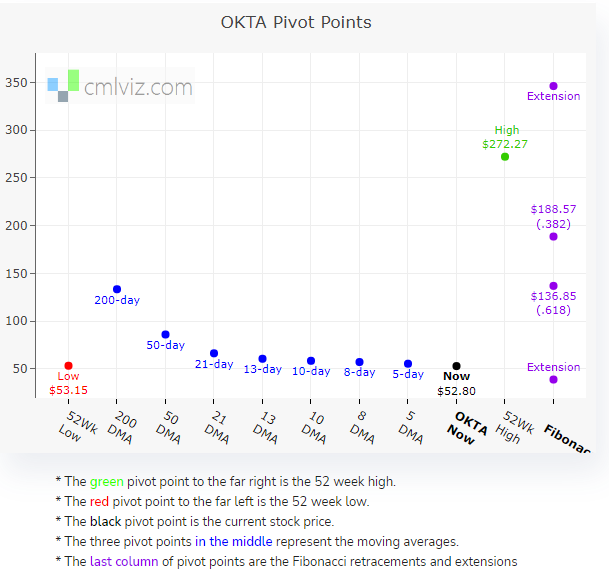
OKTA has fallen below all of its moving averages. It’s 3-month RS to peers is 4 (out of 100).
While on the one hand it’s ripe for even a relief rally, probabilities would rest with SNOW having better relative performance than OKTA for the short-term. It’s just probabilities, not a crystal ball.
For a market neutral trader, now and really any time, can be ideal for pair trading where a swing trader gets long and short stocks in the same industry with similar fundamental characteristics and factors, but designating the long positions to those with strong RS and designating short positions to those with weak RS.
A basket of longs and shorts (usually not just one of each) in this manner could be a rather reasonable approach.
In the Middle - CRWD and DDOG
So we don’t run this post too long we share both Crowdstrike (CRWD) and Datadog (DDOG) charts with trend support and moving averages with minimal commentary:
First we share CRWD:
Next we share DDOG:
Both CRWD and DDOG have two of the highest FCF margin percent measures, so these companies are executing beautifully. For swing traders looking for more long choices whether to pair off with a short or simply to mark in a watchlist, Pattern Finder also has an extraordinarily powerful screener.
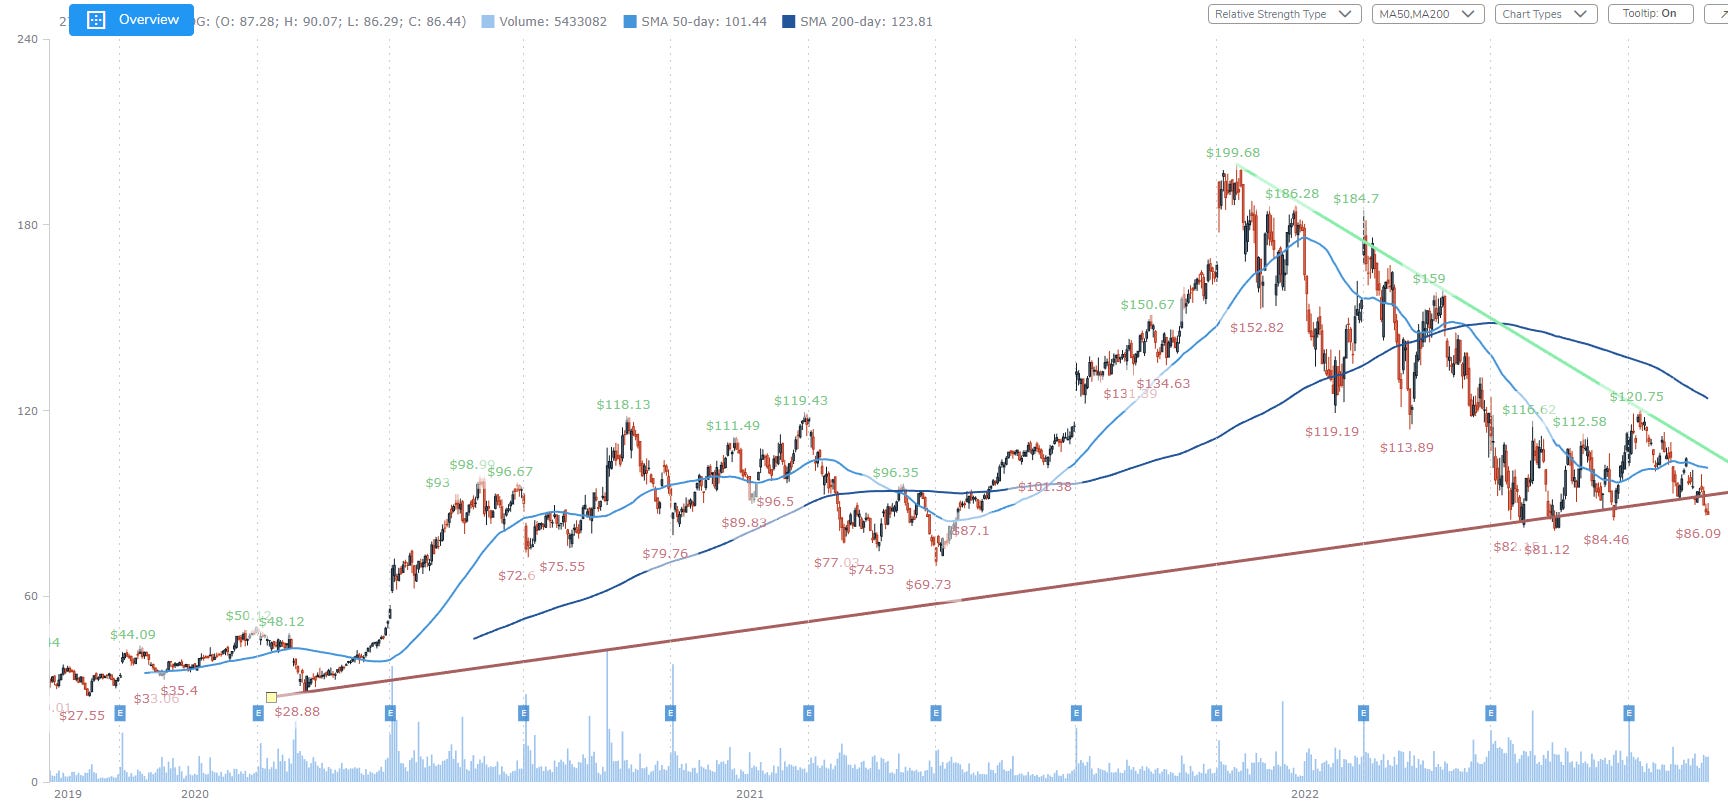
In a relief rally, a bounce for CRWD stock could rise to the intersection of the 50- and 200-day SMAs as a profit zone (from the current $159 to about $185).
DDOG’s profit zone would be either at the 50-day SMA or the trend resistance drawn by Pattern Finder.
We do note that DDOG has fallen through support and, much like most of tech, is in full blown technical failure (below the 50- and 200-day SMA and below trend support).
That’s it!
Thanks for reading, friends.
What’s Next
We will continue to share charts and screens with short discussions over the next few weeks before the CML Pattern Finder product becomes available.
The product will have everything IBD MarketSmith® has, a lot more, like algorithmically drawn support and resistance trend lines, built with better, faster, more flexible, and more responsive technology.
It allows for additional technical signals beyond just those offered by the CANSLIM methodology, far richer fundamental screening data, but…
… it will cost 70% less. Yes, 70% less.
Stay tuned to this channel.
Thanks for reading CML Pattern Finder.
I was waiting for this from Ophir! This may be really good to use with JC's indicators.