


Market View, Inflation Data, Bullish Volume, Breakthroughs


Lede
Today we look at the SPX over three time horizons; 18-month, 3- and 5-years.
Then we look at the economic data that will likely move the market as of tomorrow, and finally, our standard sharing of unusually heavy buying volume on the day and we even sneak in a health tech stock with a breakthrough of resistance.
The Market - SPX
In my world, inflation is the only thing that matters as I evaluate the broader market, so let's start with three different time frames for SPX and then the data that is coming this week.
We start with the shorter-term 18-month chart and as always we let Pattern Finder automatically draw in the congestion lines (pink lines) as well as trending support (red line) and trending resistance (green line)

The shorter time frame shows us that SPX is essentially at its resistance level and it will take some serious news and volume for us to get the Santa Clause rally into the end of the year.
Then we flip over to the 3-year chart:

This chart reads as the 18-month chart does, but we see there is a recent ascending base in early to mid 2021 that gives us more information.
The top of that ascending base (the last base), has created a congestion line that was met two times afterward (it’s magic)as support. Now, it acts as resistance.
The 3-year chart reiterates the 18-month chart and even strengthens the argument that it will take substantial volume and news for the SPX to move higher in the medium-term.
Finally, we look to the 5-year chart:
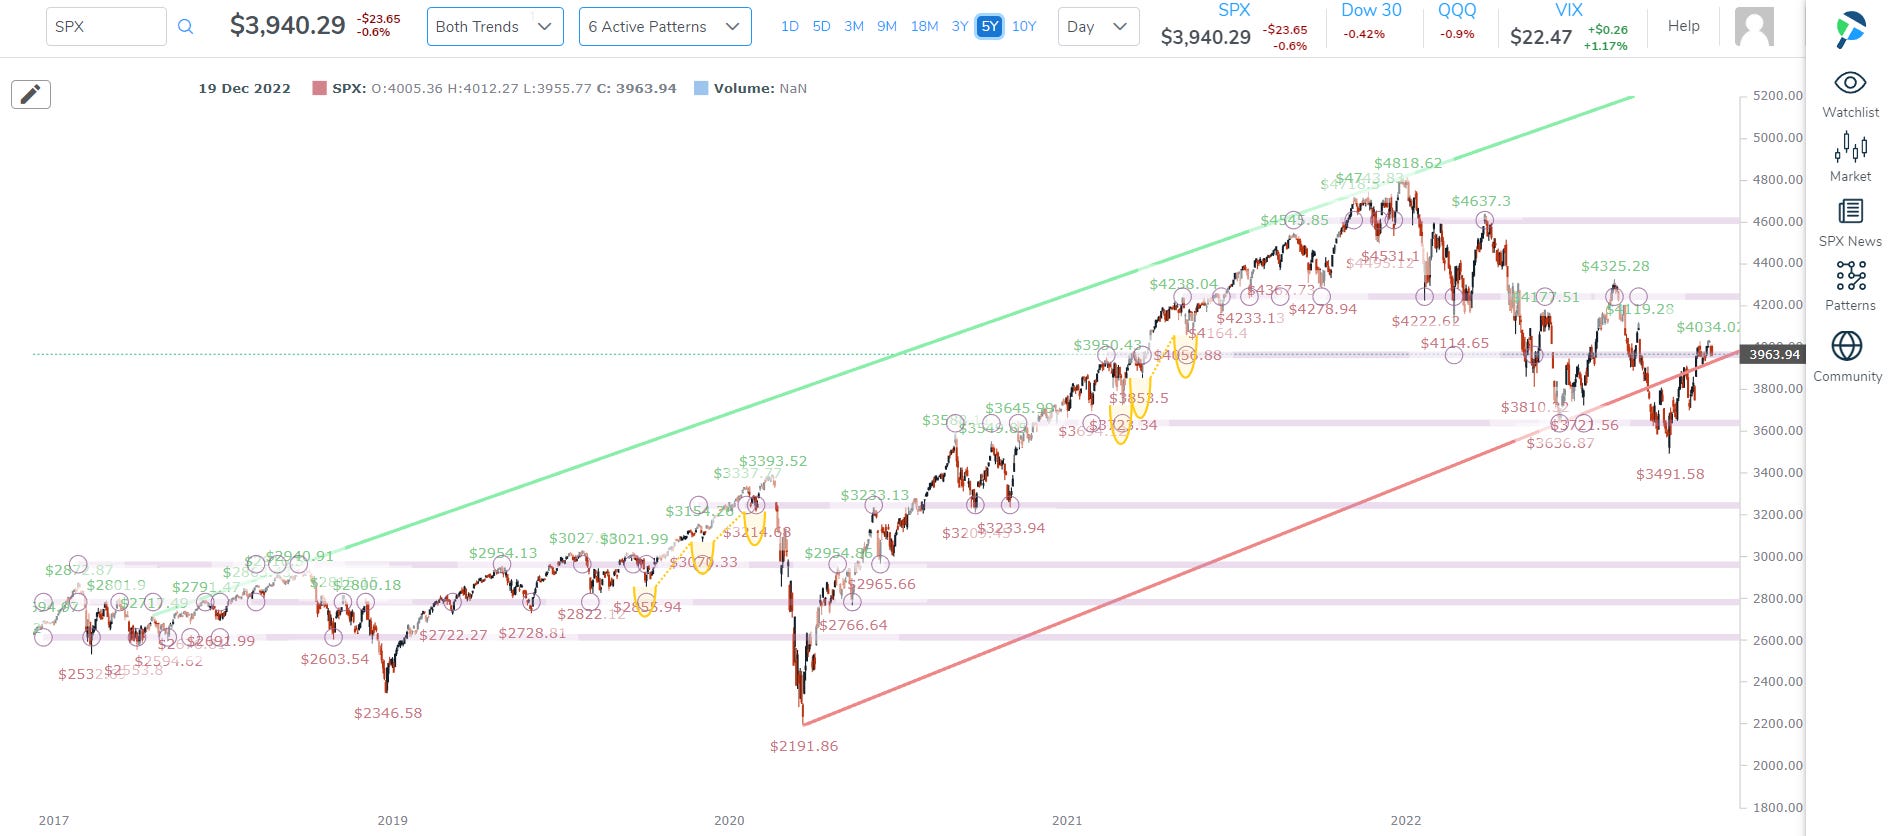
This longer-term chart is yet more ominous. It shows SPX on multi year resistance as formed by the COVID low and trending higher lows.
While this chart reads that there is upside in the longer-term view of the market, in the medium-term, yes, we are still at crucial levels.
But, alas, what will move the market in an upward trajectory that the 5-year channel shows, or instead have it fail long-term support which is also short-term resistance?
Economic data.
As I shared on Twitter, this is what we have coming in the next few days. We have also included the recent trends of the data for context.
》Wednesday: JOLTS report
° Openings: 10.3M est

》Thursday: PCE / Core PCE
° PCE YoY: 6.0% est
° PCE MoM: 0.4% est
° Core PCE YoY: 5.0% est
° Core PCE MoM: 0.3% est
》Friday: Non-farm-payrolls
° 200K est

° Wage inflation YoY: 4.6%

》Friday: Unemployment Rate
° 3.7% est
The Fed, and therefore the market, needs to see the trends continue and even accelerate to the downside on all inflation readings.
Essentially what the market needs to rise is data similar to the last CPI and PPI reports (CPI and then PPI are pictured below).


Next we turn to individual stocks.
Heavy Bullish Volume
To identify stocks with heavy bullish volume on the day we use our canned screen in Pattern Finder, and we get the following results:

Note that each of these stocks, as of the time of publication, have at least 350% the stock volume today than the 30-day average.
We can pluck one out — an ADR with ticker FUTU:

We’ll leave the analysis to the reader, but we do note the stock has pushed through the nearest congestion line and has room to trend resistance (green line).
Having said that, since this is a macro focused post, we have not done our normal diligence in assessing the chart any further.
Through Resistance
For those looking for momentum through resistance, we share one of many within Pattern Finder’s Breakout Tab.

And the chart:

Conclusion
We truly hope you are enjoying using Pattern Finder and our posts and see how easy it is to improve your trading.
The page below includes the video ‘How to use Stock Charts in 5 Minutes’ so whether joining Pattern Finder as a member or not, there is value to visiting the page. Get the best charting platform and idea generator in the word:
Thanks for reading, friends.