More Bullish and Bearish Charts Ahead of Earnings With Backtests
Preface
We will follow up our prior post here on substack with a similar direction: bullish and bearish charts as we approach earnings and some backtests as well.
We continue on the path of the next step in the evolution of our analysis, by integrating results (backtests) from our TradeMachine® product for one of the charts.
I asked Chat-GPT (4.0) to describe TradeMachine and it did a reasonable job. (I deleted some of the errors.)
CML TradeMachine is a comprehensive stock and options backtesting platform designed to enhance your trading strategy development and optimization process.
Offering an easy-to-use interface, this platform enables users to rigorously test their trading ideas using historical market data, helping them make data-driven decisions in the financial markets.
Key features of CML TradeMachine include:
• Comprehensive Backtesting
• User-friendly Interface
• In-depth Analytics
• Continuous Updates
For non TradeMachine members, please note that the first part of this post uses both TradeMachine and Pattern Finder, so the backtesting results we share here are not a part of Pattern Finder.
I just don’t want people confused about what is and what is not available in Pattern Finder.
You can learn more about TradeMachine here:
OK, OK, time for charts…
Bullish Charts and a Backtest
We will start with one ticker that we were alerted to by the Today Tab in TradeMachine. You can read what the Today is, here.
We’ll share the backtest results, but only the summary tile, not the full blown data as that is reserved for TradeMachine members.
Then we’ll go with our chart analysis from Pattern Finder.
We continue with the premise of pre-earnings optimism and start with CROX. Here is the backtest summary:
This backtest looks at the results of getting long a slightly out of the money call (40 delta) one-week before earnings for CROX, and then closing the position before earnings - this is not an earnings speculation backtest (but we have those too).
Here is the stock chart from Pattern Finder.
CROX has been walking up support and has broken through the nearest congestion line.
We zoom in for clarity:
It’s a reasonably bullish chart and with a backtest behind it, the odds feel like they are in favor of the bullish trader for a swing trade.
Obviously, probabilities are not guarantees so don’t ever use backtests as anything other than guide posts.
Next we turn to Pattern Finder as a stand-alone and one of the bullish charts screens that are built in. We start with ticker CRM.
Here is the 3-year chart, and as always, we let Pattern Finder mark it up:
Congestion lines (pink)
Trend support (red)
Trend resistance (green)
PnL zones
CANSLIM patterns
This is another chart where the stock has “walked up support” just as the stock is making higher lows.
The nearest PnL zones are pretty tight, but the extended zones (the second rectangles to the top and bottom) are instructive as well.
We zoom in for clarity:
Earnings will be reported soon, so a swing trader should be aware of that, but this is a constructive chart.
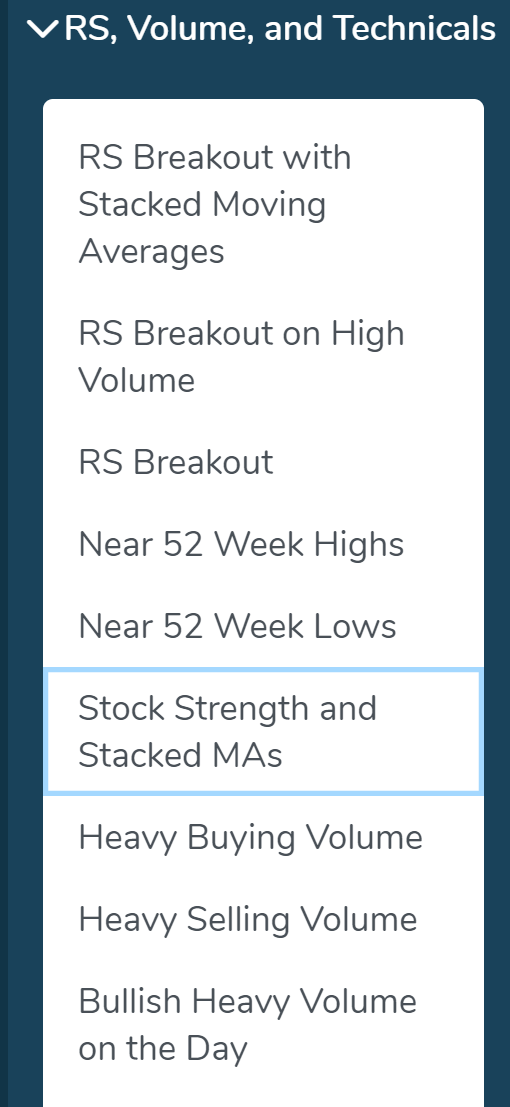
Finally, there is a list of over 50 stocks that qualify for the “Stock Strength and Stacked MAs” and Pattern Finder members to peruse that screen (“Stacked MAs is our shorthand for stacked moving averages):
OK, time to have a look at the bearish side.
Bearish Charts
For this section we turned, again, to our bearish directional charts screens and we plucked out MNST.
This stock was in fact the best performing stock over a 20-year period so it’s rather well known for that distinction, but in the short-term, it has a bearish look.
Note the recent consolidation range, which is automatically marked up by Pattern Finder, and then the current price right on top of both a congestion line and trend resistance:
We can zoom in for clarity:
This is a bearish to neutral chart and a target downside zone of about 8% lower is there, for the bearish trader. Note earnings dates with all of these charts which can discombobulate the short term chart zones.
Finally, we draw Pattern Finder members to the “Heavy Selling Volume” screen and a list of 25 tickers with weak charts and downside volume on top of it.
Aaaand… that’s it for the day!
Conclusion
You can do this yourself (not including backtesting) inside Pattern Finder; it takes about 3 seconds per chart, if that.
We are offering a huge discount and some demo videos to explain the capabilities, below. Pattern Finder: The Next Era of Charting.
The final price of Pattern finder will rest about 5x higher than the introductory offer found on the page above - and that page locks in your low price.
Pattern Finder: The Next Era of Charting.
And, for those that want TradeMachine, our stock and option backtesting platform, you can watch an explanatory video and learn more here: TradeMachine - Discount
Thanks for reading, friends.


