More Chart Breakthroughs on Inflation Day
Lede
It’s official, the pattern breakouts scan is live in Patten Finder, as we alluded to in the prior post.
Today we look at breakouts from resistance, double bottoms, and then screen for buying strength with strong relative strength (RS).
Resistance Breakouts - Chartists
We’ll start by looking for stocks that are experiencing a breakthrough resistance on both the 18-month chart and the 3-year chart (a dual time frame confirmation).
We see a few stocks that meet the criteria and we’ll pluck two out.
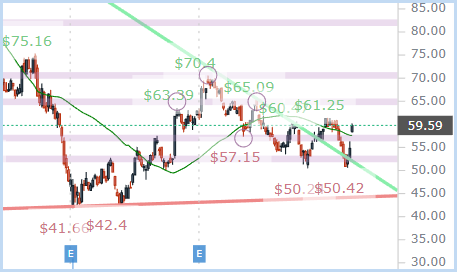
We start with a tech name that has been bludgeoned, New Relic (NYSE:NEWR).
Before we even look to the charts we note that the stock has a weakish 3-month RS (48/100), weak-ish buying strength (44/100) and weak fundamental rating (23/100).
We allow Pattern Finder to automatically draw in the congestion lines (pink) and the trending support (red) and resistance (green) lines. We focus on that breakthrough of resistance. Finally, we allow Patten Finder to draw in the 50-day SMA.
Here is the 3-year chart.
We have also included the RSI chart below the stock chart and note that RSI is about 50, which is not overbought.
When we zoom into the chart we can see the breakthrough which is also met with a touch of the 50-day SMA, but through recent congestion.
NEWR, like most stocks today, has gapped up — but it was already through resistance before today’s reaction to CPI, so this is a follow through.
The next congestion line could act as resistance (or a profit zone) at about $65 and support is either at the $57 level just surpassed today, or perhaps with a little more room to ~$52 (the next congestion line).
Next, we turn to a non-tech stock: TPG Inc (NASDAQ:TPG).
Pattern Finder tells us that this in the finance sector which has done quite well in the inflationary environment reflected by a decently strong 3-month RS (75/100) and very strong buying strength (91/100).
Here is the 3-year chart, with all the same fixings automatically drawn in as the NEWR chart, but we add in Fibonacci extensions and retracements. (Also note that TPG has not been public for 3-years, so this is a shorter-term chart).
This chart is in contrast to NEWR, which is to say while both agree on a breakthrough, TPG is through all-time highs we need to add Fib extensions to analyze a profit zone. Also, we see an RSI above 70, which could indicate an overbought stock.
A profit zone could be all the way to the 1.27 Fib extension and the loss zone would be at the congestion line ($34).
We note, again, that RSI is extended.
Now we turn to a different tack for idea generation, equally as useful, just different.
Technical and Fundamental Screen
This time we turn to the pre-built from for the CML 200 - a list of 200 stocks that meet specific criteria:
Next we do something rather simple — we simply sort by market cap.
The top two are Microsoft (NASDAQ:MSFT) and Alphabet (NASDAQ:GOOGL). We do a multi-time frame analysis of MSFT starting with long-term (10-yrs using monthly candles):
We have added in the 10-month SMA. In general, following my preferred analytical framework (How to use Stock Charts in 5 Minutes), I would stop here — the long-term chart shows a stock through support, which is technical failure along with trading below the 10-month SMA.
But, let’s take this analysis all the way through. We then move to the medium-term chart (3-years):
This chart looks better, with a fierce bounce off of the algorithmically drawn support form Pattern Finder, but… the stock is right at the 50-day SMA and right at congestion.
We actually do have multi-timeframe agreement. The 10-yr charts reads ‘caution, below support’) and the 3-year chart reads ‘at congestion and at 50-day SMA).
For completeness, we turn to the 18-month chart.
We see agreement again with the short-term chart, but it does look a little better than the other timeframes.
Is MSFT a good speculation here? It could be!
Are there charts I like better? Yes, there are.
Conclusion
You don’t need me to find trades and there is always a bull market somewhere.
Patten Finder is a charting and technical platform with robust screening for fundamentals, growth, RS, buying intensity, volume, and a much more (including all of the CANSLIM patterns, like cups, cups with handles, ascending bases, and the rest).
You can learn more on the page below, which includes two short videos (one for patterns and one for screening) and a very large discount.
The page below also includes the video ‘How to use Stock Charts in 5 Minutes’ so whether joining Pattern Finder as a member or not, hopefully there is some value to visiting the page: Learn about Pattern Finder
Thanks for reading, friends.


