


Oil Mega Charts - The "Better" and "Worse" Set-ups Integrated with AI

Preface
Today we will look at some oil stock mega caps given the news on US inventories, which came in down 12M barrels versus expectations of a small rise.
But, we will also now integrate some of the newest on the fly statistics available with our newly released Chat-GPT power tool that made a breakthrough to get real-time data into Chat-GPT, then allows it write code on the fly and produce statistical analysis as well.
The next versions of this tool (not yet!) will allow traders to write free form text to find profitable technical set -ups, something like this:
User: I want a bullish strategy
Response: Alright, are there any indicators you want to use?
User: I like moving averages
Response: OK. Is there anything else you would like or shall I look for the best performing strategy using moving averages and anything else I choose?
User: Yes. Do that.
Response: Are there any stocks you want to focus on?
User: Yes. AAPL GOOGL NVDA TSLA
Response: ok... Here are the top 3 performing strategies that are bullish and make use of moving averages and I searched through over 100 other indicators to produce a model…. <Charts and model delivered>
You get the idea…
The first version of the tool (which can’t do the above, yet) is available here right now for free:
The more powerful versions that will come in the next few weeks will be put into Pattern Finder, TradeMachine, and CML Pro, our pay products.
All three will see price hikes once the new power is released but until then we are offering discounts and prices will not be raised for members that join before hand.
You can check the products out here:
Pattern Finder (charting, screening, alerting)
TradeMachine (option backtesting, scanning, charting, alerting)
CML Pro (stock and economic reasearch)
OK, onto charts and fresh analysis.
Oil Megas
We start with XOM, which has a great looking chart.
There is a long-term upward channel of higher highs and higher lows and was luck would have it, it has recently bounced off of one of those higher lows and may be headed higher in that channel.
Here is the 3-year chart where Pattern Finder’s algorithms draw in congestion lines (pink), trend support (red) trend resistance (red) and the target zones (red and green shaded areas) at the end.
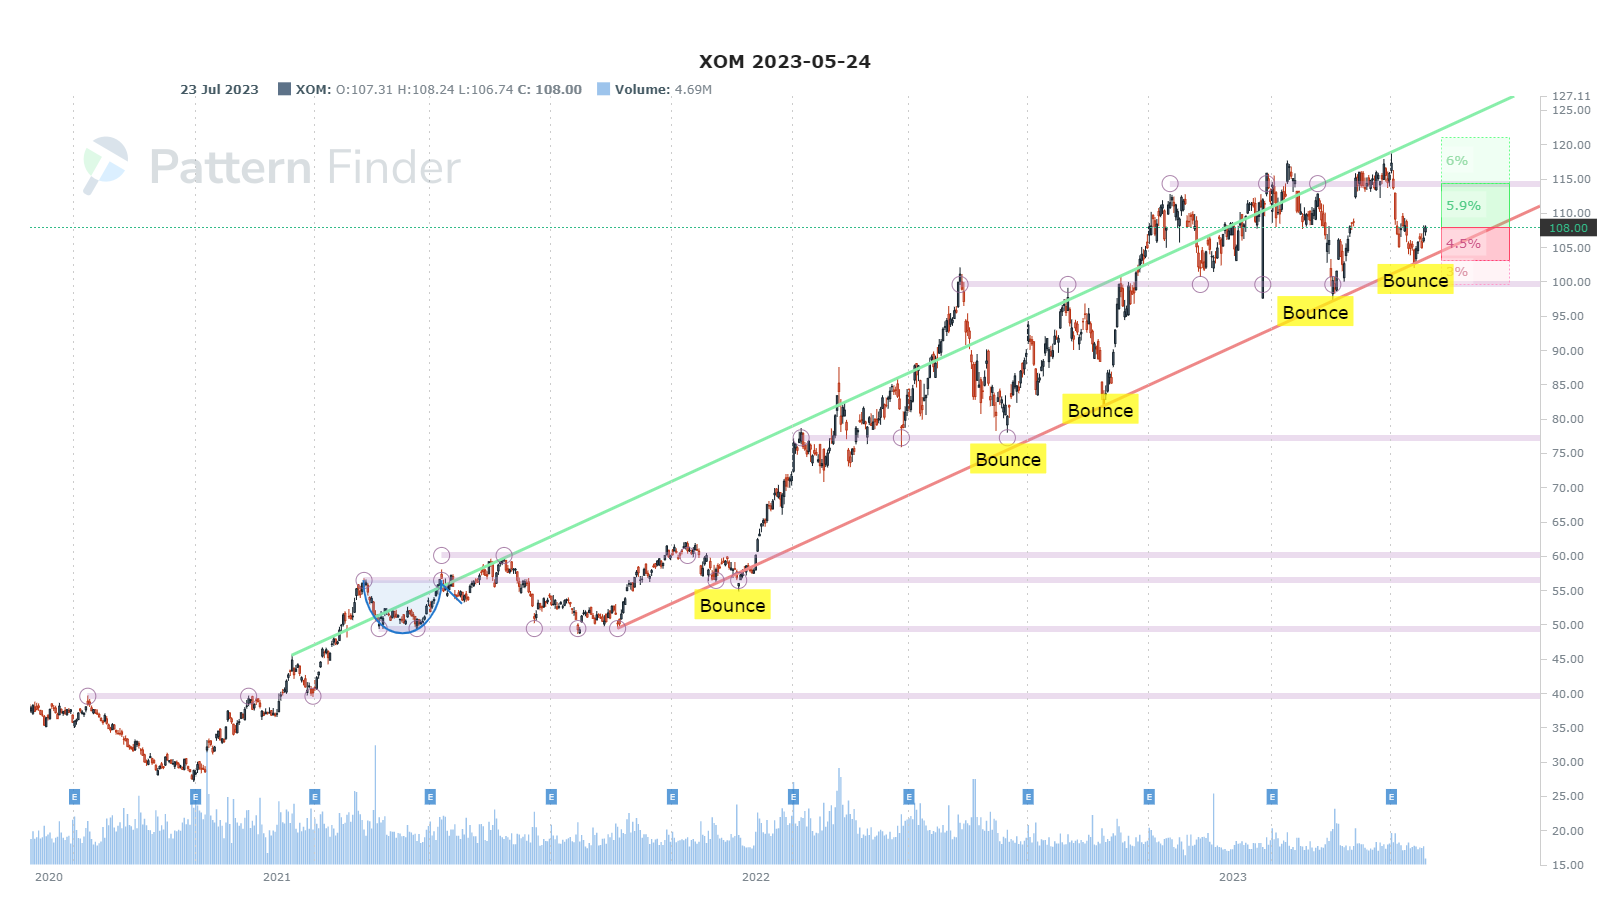
We zoom in for clarity:

And now we turn to our new tools for some further analysis.
First we compare XOM to the market:
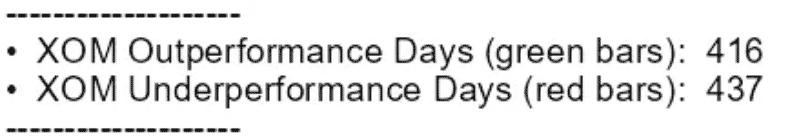
And our AI tool decided this was helpful: day-by-day comparison of XOM to the S&P 500, where we get several measures:

We see that XOM actually underperforms the market more often that it outperforms on a daily basis (416 days of outperformance versus 437 days of underperformance):
But we also see three other phenomena:
The median outperformance for XOM (on days it outperforms the market) is 1.25% versus the median underperformance of -1.15%. When that is taken over 3-years, yeah, we get outperformance.

XOM has outperformed the S&P 500 with 50% returns versus 27% for the S&P 500.
The outperformance days have fatter tails (called lepto kurtic) versus the fatness of tails for underperformance days.

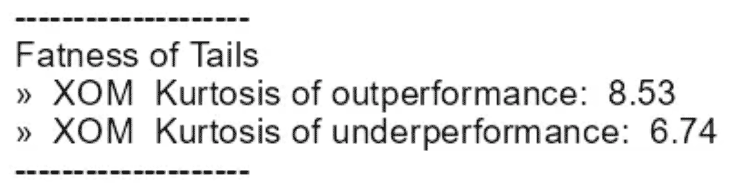
This all means that on days where XOM outperforms it more than compensates for days it underperforms and the “tail risk” has been more to upside reward than downside risk.
We can measure the alpha as well with this prompt:
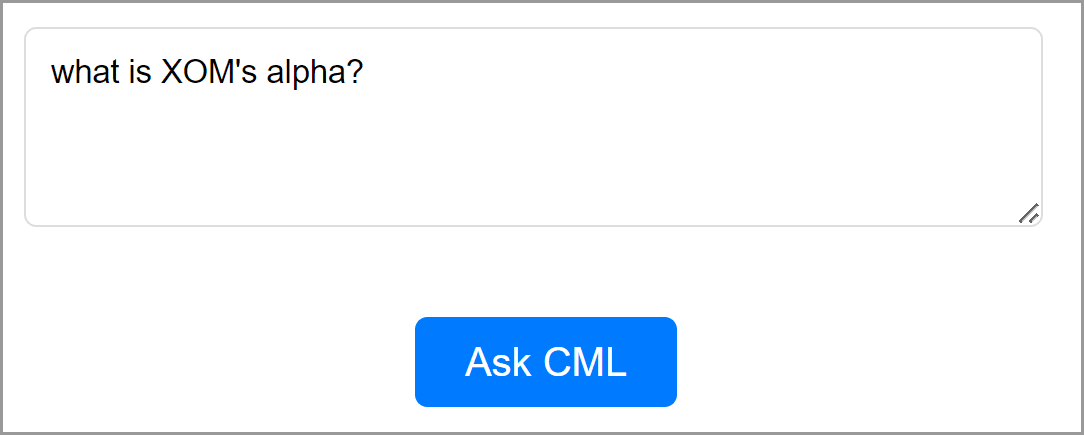
We’ll let interested traders do that one…
Next we turn to another mega cap oil company - this time ticker CVX.
Here is the 3-year chart, and it is less impressive than the XOM chart from above, but could be at a rally spot.
It’s right on trend support drawn by Pattern Finder’s algorithm.
CVX bounced off of the latest test of support but did not follow through by returning to the highs.
Here is the 3-year chart with congestion lines (pink lines), trend support (red line) and trend resistance (green line) drawn in by Pattern Finder’s algorithms:

This is a different look than XOM which held that upward channel…
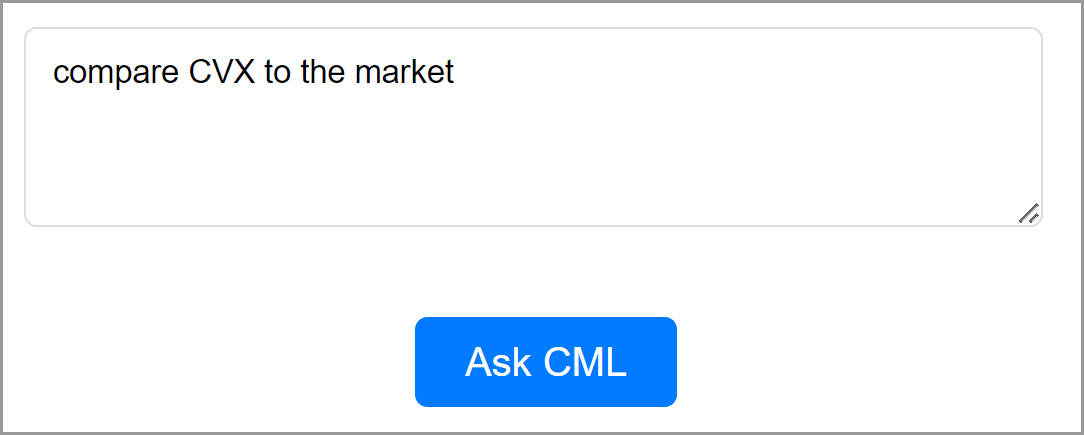
And we will go ahead and ask CML-GPT for a comparison to the market:
And this time the comparison difference is quite different than XOM.

CVX underperforms on a daily basis more often than it outperforms; that’s the same as XOM.
CVX’s median outperformance versus it’s median underperformance shows a smaller margin that XOM (0.06% for CVX versus 0.1% for XOM - that matters over three-years).
CVX’s total return over the period is about the same as the S&P 500; also quite different than XOM.
There has been more tail downside risk than tail upside reward over this period; also different than XOM.
Alright, we hope we have demonstrated how to use Pattern Finder to find stock set-ups with essentially all of the work done for you, and then incorporated a taste of our new ability with artificial intelligence.
Obviously, this new capability will make its way into Pattern Finder and TradeMachine in the coming weeks with much richer analysis, but even today, even with version 1 that is free, our CML driven ChatGPT has done us quite a bit of good and opened a new world of possibilities for trading opportunities.
Pattern Finder members can always use the “Sector & Industry Strength” tab to find the best performing sectors (or industries) and then find the differences in the ones with better set-ups.

This also opens the world to pair trading, for investors seeking a long-short balanced portfolio (long the best in the sector and short the worst; for example).
Conclusion
CML has successfully integrated real-time financial, economic, stock-chart and statistical analysis into OpenAI's ChatGPT and will offer this unique capability free on its website www.cmlviz.com.
Once the model continues to learn, in three weeks, there will be an integration into our products, and that upgrade will only be available there.
We will offer the tool for free for three weeks as we let it learn and improve right here.
We will then integrate it into all of our products; TradeMachine, Pattern Finder, and CML Pro.
The price for CML Pro and Pattern Finder will rise once this integration is complete. All products currently have special pricing today!
Click the link below to learn more about Pattern Finder:
Pattern Finder: The Next Era of Charting.
You can learn more about TradeMachine (the backtesting you have seen here and in the video above) here: TradeMachine - The Option Backtesting Giant
Don’t miss out on savings…
Thanks for reading and sharing is appreciated as well!
Cool analysis on XOM ;-))
I just tried the free AI tool. Here's the answer I got back: "As an AI language model, I do not have access to real-time data and cannot provide current information. However, I can suggest using financial websites such as Yahoo Finance or Google Finance to search for the worst performing oil stock over the past year with a daily average volume greater than 250,000. You can filter the search results based on your criteria."