


Opportunity Now - Using Tail Risk to Profit: AAPL, NVDA, MSFT, GOOGL

Preface
A trading opportunity exists. We show that today - explicitly, with an education in tail analysis, and then backtesting.
The best part…
… the tail analysis is free for any stocks on our platform; have at it at any time.
Definitions
We start with some definitions so we can move quickly forward to actual trading.
Tail Risk: The risk of an extreme event occurring that could drastically change the value of a portfolio or investment. It's called "tail risk" because this kind of event is often at the tail ends (the far left or far right) of a probability distribution, indicating that these events are unlikely but not impossible.
Kurtosis: A statistical measure that essentially measures the "tailedness" of the probability distribution of a real-valued random variable.
Tail analysis is backward looking.
OK. Now we define option volatility skew, and then move to trading.
The Option Market and Volatility Skew
Volatility is often discussed as a single number.
In the real world, the volatility of each strike price and in each month is different than the neighboring one.
Skew is simply the volatility curve formed by plotting the individual volatilities of each strike. The shape of this curve is often referred to as the volatility "smile" or "smirk."
Normally the skew forms a downward smile (or smirk) -- lower strikes have higher volatility than higher strikes.
We have included a skew chart for NFLX June 2017 options as of 10-23-2015 below.

We can see the lower strike prices (the out of the money puts on the left side of the chart) have higher volatility than the at-the-money (ATM) options and the out-of-the-money (OTM) calls to the right side of the chart.
This volatility smile shape exists for two reasons that we have discussed at length in TradeMachine, and we will not repeat here.
“Normal skew” is the option market’s reflection that downside tail risk is usually larger than upside tail opportunity.
Implied volatility is forward looking.
Hold that thought.
Tail Risk, Kurtosis, and Opportunity
Just like “normal” volatility skew, in general, when we compare daily returns of a single stock (like GOOGL or MSFT) to the S&P 500, we see that the fatness of tails (kurtosis) on outperformance days tends to be smaller than the fatness of downside tails.
We’ll show it to you.
Here are the upside and downside tail computations for GOOGL and MSFT over the last year and 3.5-years.
The units of kurtosis are not important, just focus on the size of the numbers relative to each other (which one is larger - upside our downside).
We blur out some other data to keep the conversation focused; but that matters too and is for a different time and will be in TradeMachine and Pattern Finder as well.
(Hint: the blurred out measure is skew.)
GOOGL: 1-year Tail Analysis

Note that the size of the underperformance kurtosis (left tail) is much larger than the size of the overperformance kurtosis (right tail).
GOOGL outperformed the S&P 500 11% vs 5.7% in the last year, but showed fatter downside tails (14.93) to upside tails (2.81).
GOOGL: 3.5-year Tail Analysis

GOOGL outperformed the S&P 500 82.1% vs 29.3% over 3.5 years, but showed fatter downside tails (16.51) to upside tails (8.97).
We see that while GOOGL has far outperformed the market over the last 3.5 years and the last year, it does demonstrate “normal” tail behavior versus the market: the downside tailedness (kurtosis) is larger than the upside tailedness.
Having fat tails favoring the upside is quite abnormal and even fantastic performing stocks don’t have it.
We demonstrate that with MSFT too.
MSFT: 1-year Tail Analysis
MSFT: 3-year Tail Analysis
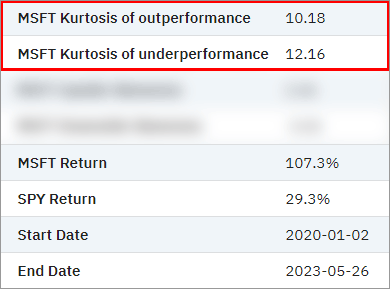
MSFT has crushed the market’s return over the last 3.5 years (107% vs 29%) and 1-year (22% vs 2%), but still, it follows the tried and true axiom that downside tail risk is larger than upside tail risk.
So, why does this matter?
Well, remember that conversation about option skew?
Yeah, the skew implies that the option market reflects greater downside tail risk than upside tail opportunity which it should…
… until there is a mispricing.
When the Option Market Reflects the Wrong Thing
We could go up and down the NASDAQ 100 or S&P 500 and find stock after stock where the option market’s “normal skew” reflects reality - the downside tailedness is larger than the upside tailedness and measures of kurtosis, like in GOOGL and MSFT show it.
But the option market does not always reflect reality, and two stocks we show that in are AAPL and NVDA. After this data, we do the backtests and prove the point that mispriced skew impacts trade results.
First, we share the kurtosis results for AAPL and NVDA over 1-year and 3.5-years, just as we did for GOOGL and MSFT.
Here are the tables - we don’t comment other than to note that for both time period and for both stocks, the upside kurtosis (the upside tailedness) is actually larger than the downside kurtosis.
We also exclude much of the distribution charting to keep this post within the limits of substack.

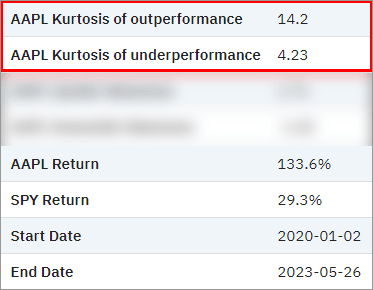
AAPL: Tail Analysis (1-year and then 3.5 years)

NVDA: Tail Analysis (1-year and then 3.5 years)
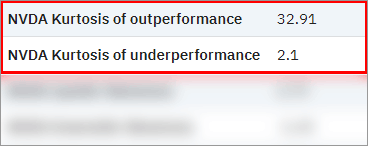

So, we have four mega caps beating the market over the medium-term (3.5-years) and the short-term (1-year), but two with normal tail behavior versus the S&P 500 and two with unusual behavior, where the outperformance tails are larger than the underperformance tails.
Now, we show what happens to the same option strategy across AAPL and MSFT, both with similar stock returns, but wholly dissimilar tail behavior.
Option Backtests
Our claim is that while the option market reflects “normal skew” for both AAPL and MSFT, where the downside puts have more larger vol than upside calls, that is a mispricing for AAPL since AAPL has realized lower downside tail risk than its upside.
And if that claim is right, if we simply backtest selling a weekly put spread in both stocks, that the win rate and the percent returned should be higher in AAPL, since it realized the downside risk less often than MSFT.
We use a weekly backtest rather than a monthly because the tail analysis we did above uses daily measurements (versus the S&P 500).
Here we show the results from TradeMachine of exactly that:
We test selling a 40/30 delta put spread in each, with one rule - the backtester never holds a position open during earnings - it just closes any open trades two days before and waits four more days before starting again.
(Delta is a measure of “moneyness” of an option, where 50 delta is at the money, 100 delta is an option that is equivalent to long stock, and numbers below 50 are out of the money.)

And what do you know: While MSFT has crushed the market in the last year, up 22% versus the market’s 2%, selling a weekly put spread, showed a 46% loss.
On the other hand, AAPL stock, which actually outperformed the market slightly less than MSFT did, with a 18% stock return versus 2% for the S&P 500, that same weekly sale of a put spread showed a 76% gain.
Yep.
Two mega caps; both outperform the S&P 500; same short put spread; and vastly different results.
For good measure, here are the results over the last 3.5-years:

Yep; again.
In TradeMachine I say, “option trading is volatility trading, whether you mean it to be or not.”
I’ll add to my mantra: “tail analysis is a golden goose to volatility analysis.”
So, together it reads like this
Option trading is volatility trading, whether you mean it to be or not and tail analysis is a golden goose to volatility analysis.
We hope this example offers evidence to the importance of that reality.
In this case we took a simple observation - the downside vol for AAPL was priced too high relative to its realized downside tail risk (versus upside tail risk), so we backtested selling it.
Please note that we are not, now, writing that these are good trades to follow. This was explanatory and in no way should be construed as trading advice.
The information contained on this site is provided for general informational purposes, as a convenience to the readers. The materials are not a substitute for obtaining professional advice from a qualified person, firm or corporation.
Conclusion
We hope this was instructive and thank you for reading and…
… as we wrote at the top that, the tail analysis is free for anyone, and it is (link at the bottom).
We just released our integration of real-time financial and statistical data into ChatGPT, and as we wrote in the press release, no, it’s not just another bu**sh**use of ChatGPT.
The speed at which product can be developed has increased by orders of magnitude – call it 10x or even 100x - that’s for all industries.
That means that what was once a moat builder, is now a commodity; product in and of itself is a commodity.
So, in the paradigm people like to use of signal versus noise, product, on its own is the noise.
The signal is product that has utility.
The number of products will increase by orders of magnitude but the number of products delivering value will not because of a simple but crucial fact:
There has not been an explosion of domain experts.
So, who will win?
The winners will be those with top 1% domain expertise on the one-hand, and with those same domain experts actually building the product.
That’s who we are. That’s what I do. That’s what our CTO does.
And now we’re going to do our best to prove it.
A scannable and more advanced version of this analysis, and a lot more, is coming to our three products in the next several weeks.
CML Pro is a stock and economic research platform. We’ll put a pin in that product for this post since it is not charting or option related.
TradeMachine is our option backtester. It’s been available since 2015 and tens of thousands of option traders have used it as their secret weapon.
Pattern Finder is our newest product - it is an advanced stock chart platform with our algorithms drawn on top, along with a remarkably robust screener and fundamental analysis data.
The products are going to improve - slowly, and then all at once.
The prices are going to go up - slowly, and then all at once.
But the price for members that join before we integrate our vast libraries of AI over the coming weeks, months, and years, that are in development, like this tail analysis report turned into scannable data, will not go up.
You can learn more about each product in the links below.
Learn about Pattern Finder here.
Learn about TradeMachine here.
Thanks for reading, friends.
Our ChatGPT powered tail analysis report can be found here, with this prompt:
“Compare AAPL returns to the market”
(Change AAPL to any ticker you like.)
Great article. I would love more deep dives into volatility. Also, I would love the trademachine backtesting software to include more technicals for vol besides IV30 (like IV rank).