


Right Now: What Our AI Says about AAPL and Other Mega Caps: Weekend Charts

Preface
The thing about AI, particularly in finance, is that cool gets tired fast.
Cool won't cut it; it's entertaining but in the end, finance is about results.
Today we will demonstrate just the beginnings of actual AI output from our first of its kind live data integration with ChatGPT.
And while we will get some cool, indeed, what we want is to learn something that we did not know, and for that to spur us onto to something else we did not know, and for that process to deliver an answer.
We get that from free form usage of our integration, and share just a snippet of it right here, right now, in this post.
Later in the post, we do our weekend work and we will, again, look at five mega caps.
The Big News
We have said before that ChatGPT driven AI is coming soon to Pattern Finder, TradeMachine, and to Capital Market Laboratories (CML) in general.
And examples prove it below…
This groundbreaking achievement unites the prowess of AI and up-to-the-minute data for the very first time.
To date, ChatGPT is extremely limited for use cases requiring current data, because ChatGPT’s “learning” is currently based on information with a hard data cutoff at September 2021.
There has been no meaningful way to effectively use ChatGPT or other powerful new AI tools for market and financial analysis.
That barrier has been broken and soon we will serve up insights unlike anything previously available.
Now, we have updates and real-time usage examples... and we go beyond "the cool."The Big News
We have said before that ChatGPT driven AI is coming soon to Pattern Finder, TradeMachine (our most advanced trade analysis feature with option backtesting) and to Capital Market Laboratories (CML) in general.
And examples prove it below…
We take a thrilling leap forward in AI innovation that has never been done before by unveiling a pioneering ChatGPT-driven tool for economic, financial, and stock chart data analysis, seamlessly integrated with real-time data.
This groundbreaking achievement unites the prowess of AI and up-to-the-minute data for the very first time.
To date, ChatGPT is extremely limited for use cases requiring current data, because ChatGPT’s “learning” is currently based on information with a hard data cutoff at September 2021.
There has been no meaningful way to effectively use ChatGPT or other powerful new AI tools for market and financial analysis.
That barrier has been broken and soon we will serve up insights unlike anything previously available.
Now, we have updates and real-time usage examples.
Timeline and What Pattern Finder and TradeMachine Members Get
We will be releasing version one of our real-time financial data powered ChatGPT tool to our free site www.CMLviz.com next week.
That will be a version 1.0. We will collect data as investors, researchers, and traders use the tool. We will iterate on that tool for at least two weeks.
By then we should feel comfortable enough to integrate an advanced capability version into our pay products:
Pattern Finder (charting and screening)
TradeMachine (charting, scanning, option backtesting)
CML Pro (stock and economic research).
So, we expect the tools in better and more advanced form in products within about a month.
At that time, the price for Pattern Finder will go up for new users (but not for those already paying members).
For TradeMachine, we will provide all of that, and go even further, plugging backtest results into ChatGPT for a free form chat to backtest interface.
These integrations into our pay products will be iterated upon often - so they too will be early versions of the ongoing development.
And here are some updates from the tool as we tune it internally; and we get cool, but we also get led on a short journey of discovery that wasn't obviously apparent to us as we started.
First we simply asked for a comparison of AAPL to SPY (you can do this with any stock). We thought we would get maybe a stock chart of the two.
Turns out not; we went beyond cool.
This seemed like a simple enough question. We were not prepared to actually learn something new... but we did... twice: Here is the first response:
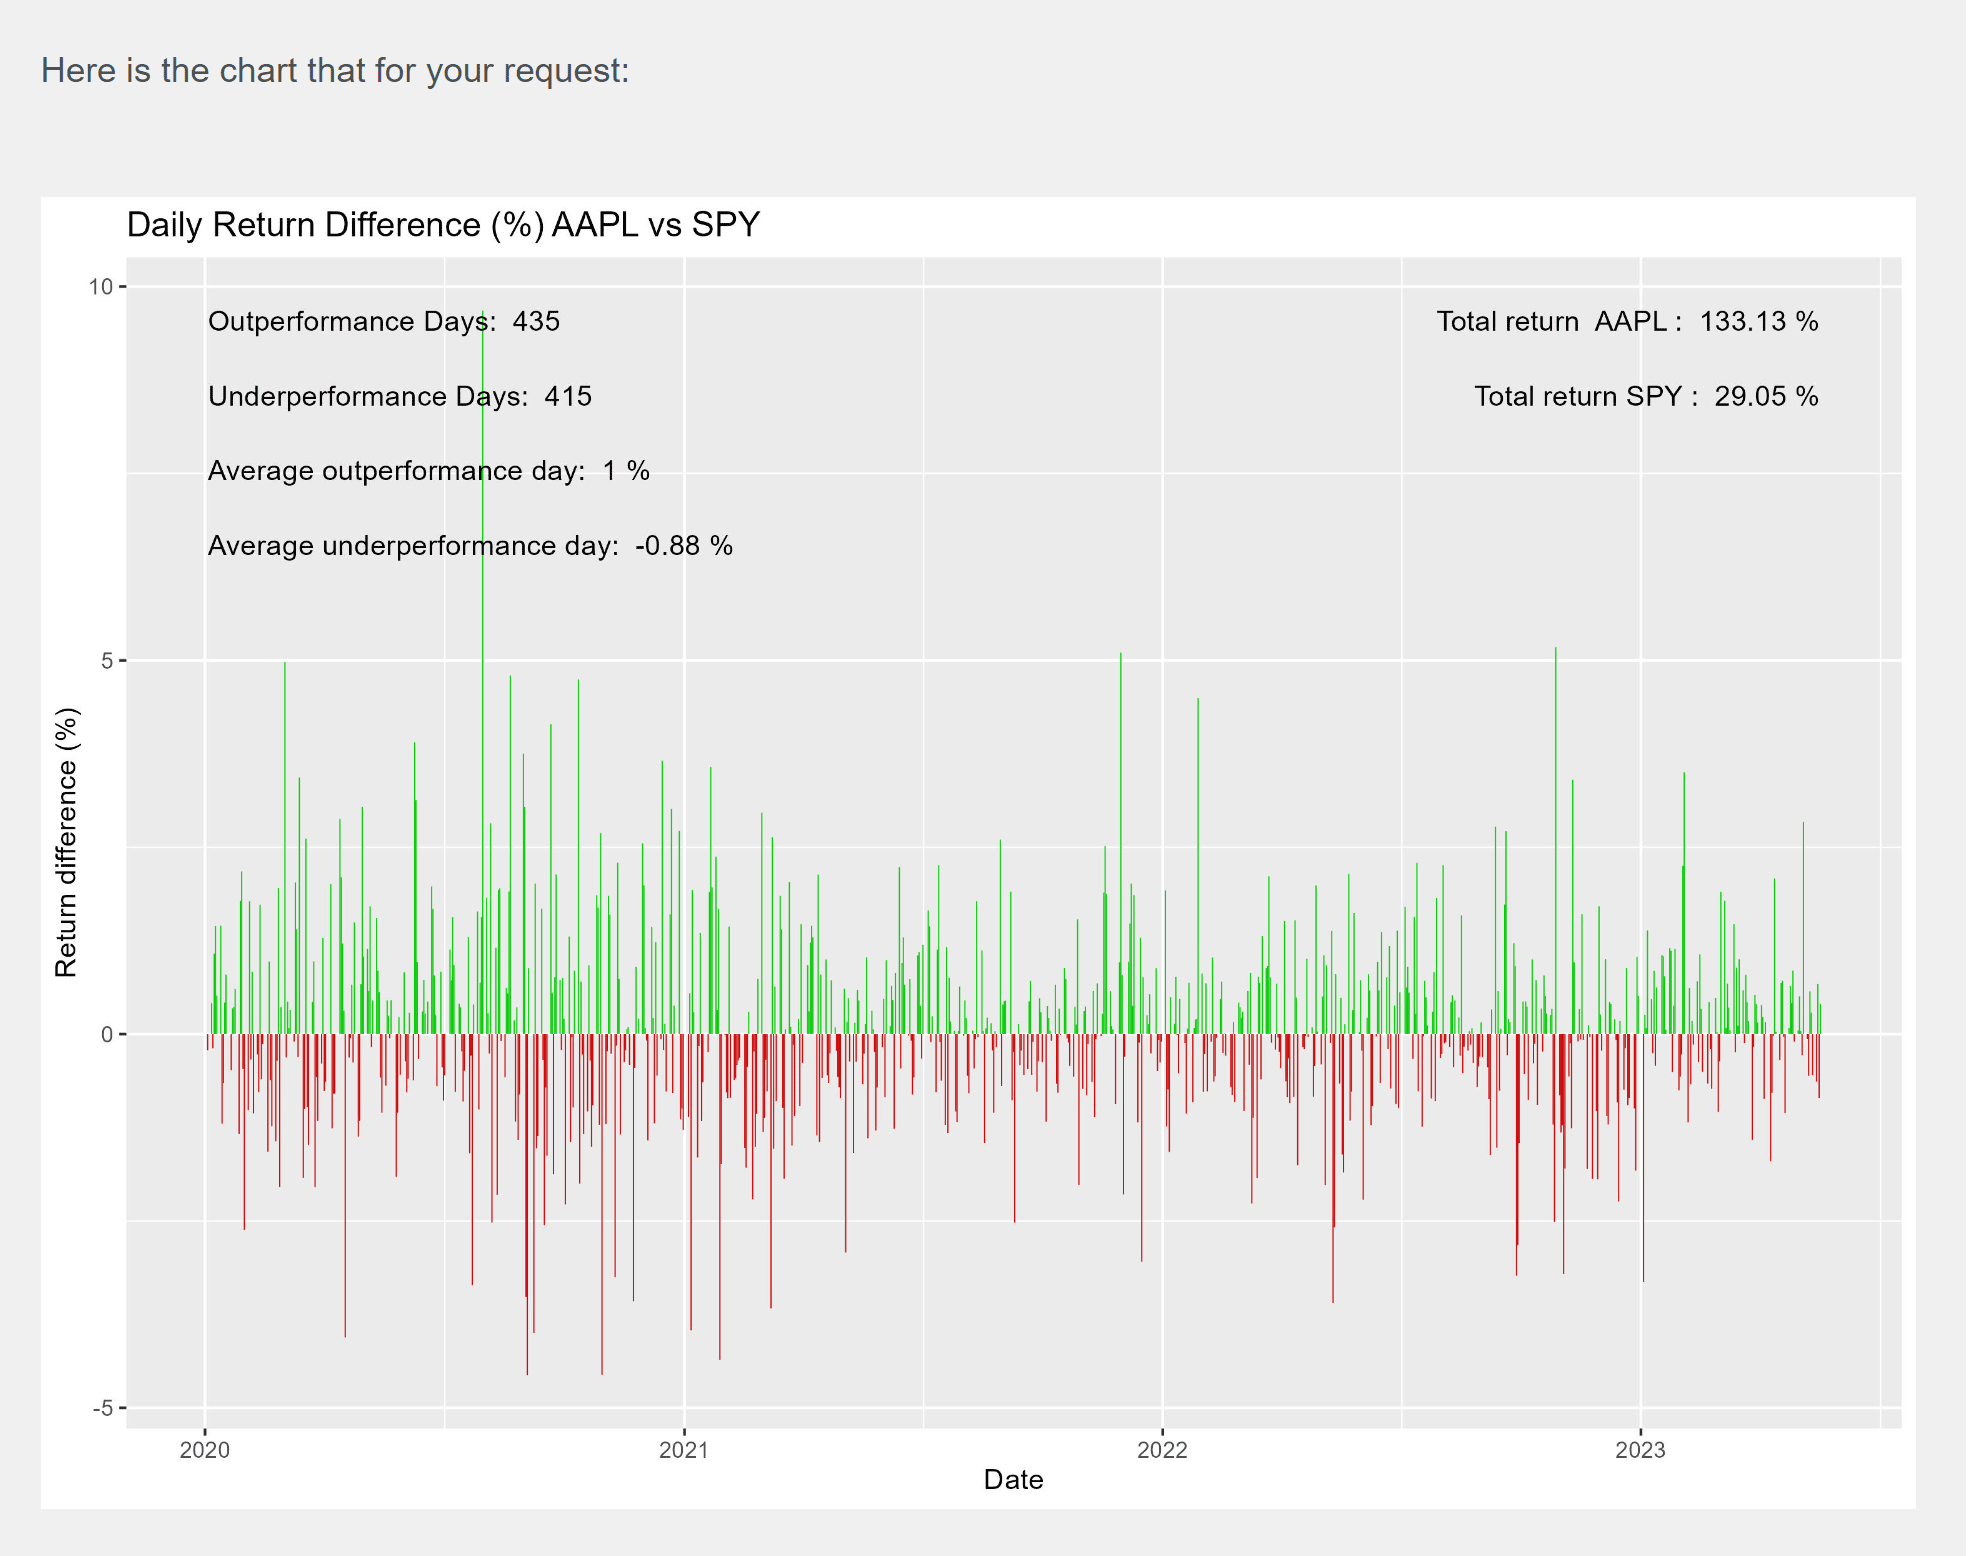
We see a fascinating result, as our model decided that a chart of daily return comparisons for three years was relevant - and it is... and the stats done with the chart made the point. It took us beyond cool:
AAPL outperformed the SPY on a daily basis 435 times versus 415 times where it underperformed. That’s just a 51% daily outperformance ratio.
No big deal, right?
Well, it seems like no big deal until we dig deeper into what our ChatGPT powered and internally trained AI model also showed us:
The average out performance day comparison was +1% versus the average under performance day being just -0.88%.
That means that while we see 51% of the time AAPL outperformed SPY on a daily measure, the times that it outperformed showed significantly higher outperformance than the other days (1% outperformance versus 0.88% underperformance.
When you get those numbers for 3-years, the result is the final piece of data we received from our tool:
AAPL rose 133% in that time period versus the SPY up just 29%.
That was cool, but most importantly, it was not obvious - that a small outperformance by count (51% vs 49%) would be supercharged by the level of out performance versus underperformance.
That should mean AAPL has provided alpha and that led us, instantly to further our journey - a new question.
When we next ask our ChatGPT powered tool to measure that for us, we get the following:
And here is the response:
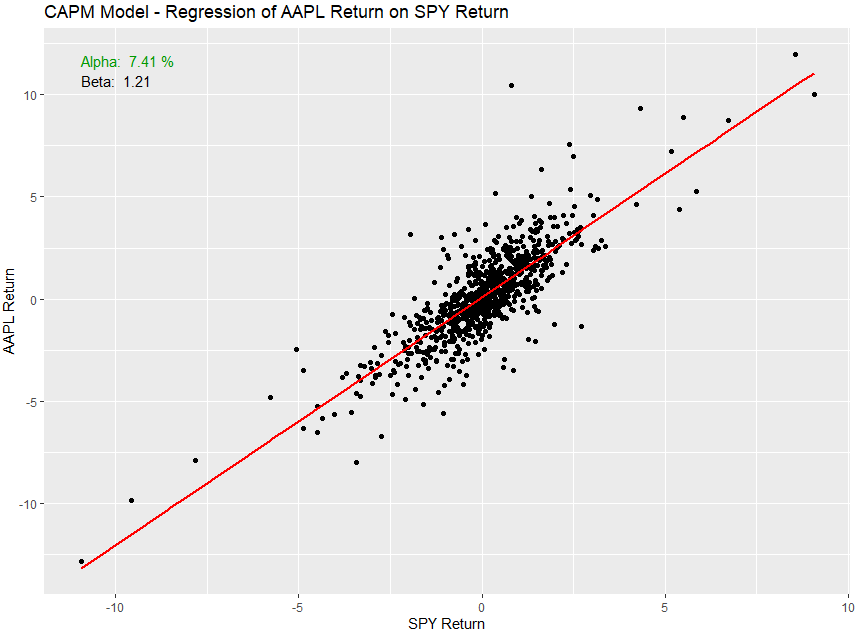
At the top, in the upper left hand corner, we can see that our tool has computed alpha (excess return beyond that received from market risk) as 7.41%.
That was a wow, and given where we started, not what we expected to discover - in fact it wasn't even in our minds.
So, yes, AAPL has provided genuine alpha in the last 3-years and no, it’s not just market risk.
That's more than cool. That is knowledge and you know the next question - you're having it too - what other stocks provide alpha? How much? What is their daily return percent? How much are the wins to losses?
It's not just cool anymore - now it's urgent. I want to know. You want to know.
And, of course, this can be done for any stock and whatever the tool decides is relevant, we’ll get that too.
The future is bright for all CML products, not just Pattern Finder, and while we can’t share it yet, what we will be able to do with backtesting in TradeMachine and fundamental and economic analysis in CML Pro will be fantastic as well.
Prices will go up, but not yet. So this would be the time to lock in lower prices.
OK, now we can do our chart analysis!
Mega Cap Charts
We start with GOOGL, and first bring back the what we shared last Friday with the stock at $117:
GOOGL will either get back to that triple top and break into a new paradigm higher, eyeing $135, or that same triple top will end this short-term rally.
And now turn to the 3-year chart today:

The stock has risen $6 to $123, and the $135 level still acts as the next resistance. The odds pointed to more upside than downside last week, and the odds played out well for longs.
Next we turn to AMZN as well as our commentary.
Last week we wrote this, with AMZN at $105.66.
AMZN has realized the short-term upside reward:risk bullish set-up and rests very much in a situation where it will either breakthrough that trend resistance (green line) or fail back to congestion.
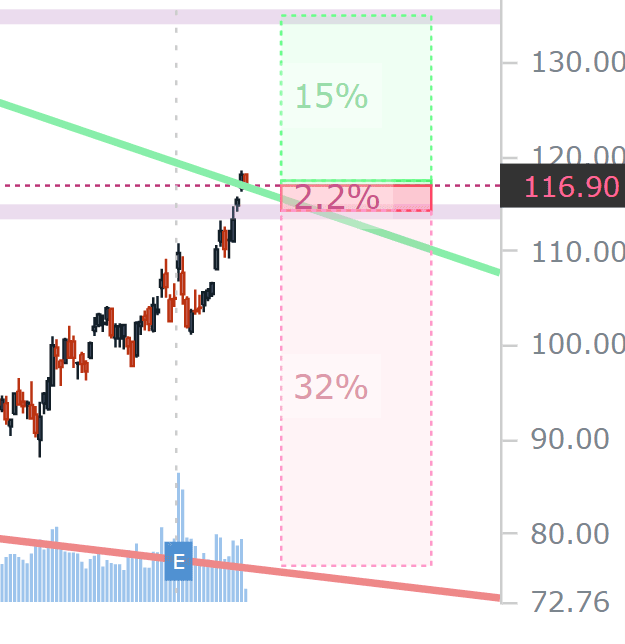
Now we turn to the current 3-year chart for context, with the stck having rallied $10 to $116.

We can zoom in for clarity. A very (very) tight stop at the ~$113 level gives a small downside risk with the next upside congestion and target at over $130.
We also wrote about META and shared the following, with the stock at $233.
Indeed META was exhausted from the prior large moves and that wall of resistance formed by the former gap down held. For now META will bounce in between that resistance zone and rising trend support.
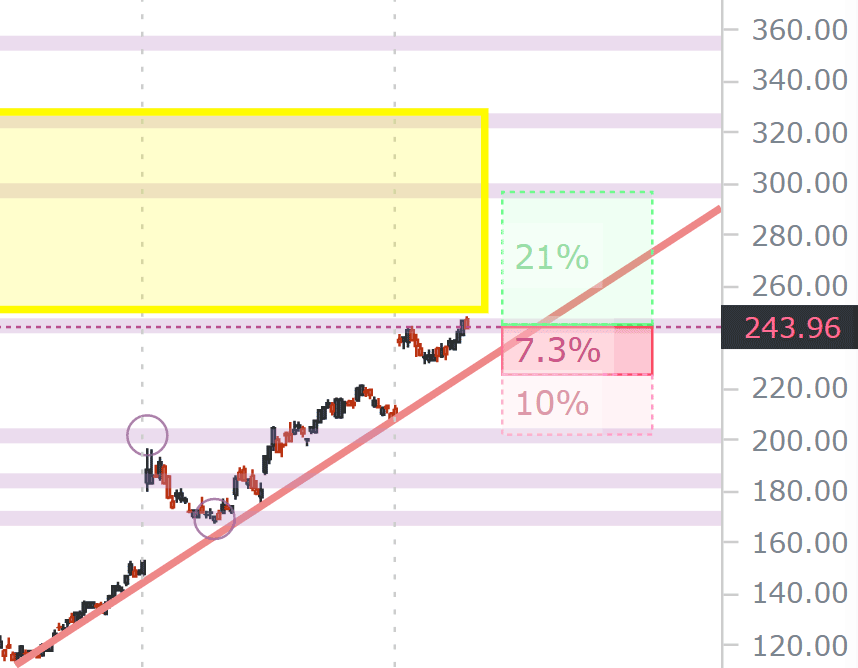
Here is the updated 3-year chart with the stock at $243.96

We can zoom in as well. META has regained that congestion line and a risk:reward trade-off appears to be favorable with a 7% downside target and a 21% upside target but with the huge caveat that the upside would require a gap fill and that usually takes heavy volume.
We discussed TSLA as well, and wrote the following last week:
If TSLA cannot hold it’s support at ~$165, there is a lot of room below, but, if it consolidates here, there is a lot of upside.
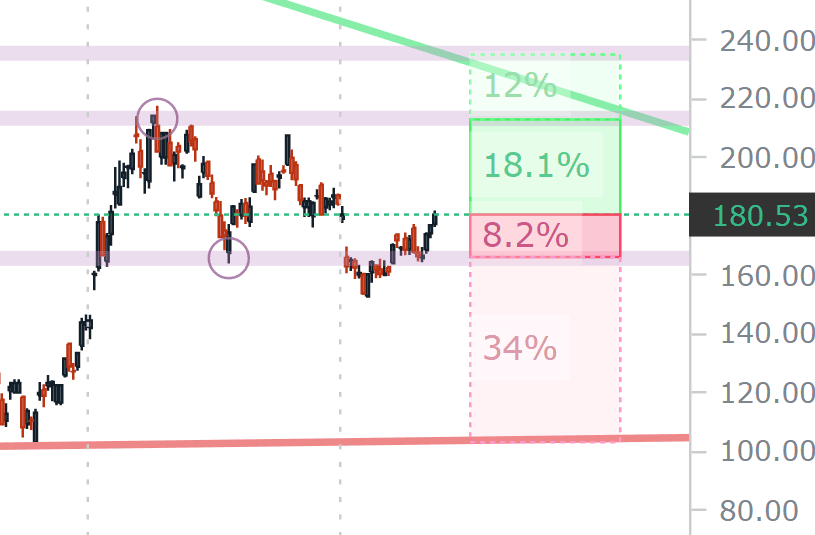
Now we turn to the 3-year chart with the stock at $180.53.

We can zoom in and see the new favorable trading range: a top at 8% lower and potential upside of about 18%.
Finally, we wrote about AAPL as well last week with this with the stock at $172.57.
AAPL has had a great up trend but it still looks toppy. It will take some strong news to move it higher.
Now we turn to the 3-year chart today with the stock at $175.92.
The all-time high is a huge wall of resistance and this could take a lot of volume to rise above $180.
AAPL appears toppy and the PnL zones show more downside than upside (it’s all probabilities).

Conclusion
You can do this yourself inside Pattern Finder; it takes about 3 seconds per chart, if that.
A lot more is coming to Pattern Finder, as we illustrated just a touch in the beginning of this post.
We are offering a huge discount on Pattern Finder before the upgrares with our own trained ChatGPT embedded into the product. Some demo videos to explain the capabilities (without ChatGPT) are included in the link below.
Pattern Finder: The Next Era of Charting.
And ChatGPT driven AI is coming soon to Pattern Finder.
We take a thrilling leap forward in AI innovation by unveiling a pioneering ChatGPT-driven tool for economic, financial, and stock chart data analysis, seamlessly integrated with real-time statistics.
This groundbreaking achievement unites the prowess of AI and up-to-the-minute data for the very first time.
To date, ChatGPT is extremely limited for use cases requiring current data, because ChatGPT’s “learning” is currently based on information with a hard data cutoff at September 2021.
There has been no meaningful way to effectively use ChatGPT or other powerful new AI tools for market and financial analysis.
That barrier has been broken and soon we will serve up insights unlike anything previously available, even through professional terminals that cost thousands of dollars to use.
The price of Pattern Finder will rise substantially once we introduce this new capability.
Please do feel free to join us:
Pattern Finder: The Next Era of Charting.
Thanks for reading and sharing is appreciated as well!