


S&P 500 and Russell 2000 Charts Speak; Bullish and Bearish Chart Set-ups for Next Week

Lede
The weekend means study time, but with Pattern Finder, the studying is done for you. We review the bullish and bearish set-ups as of Friday 3-24-2023. Every chart shared here comes from the ‘Directional Charts’ screens in the screener.
Then we conclude with the S&P 500 and Russell 2000, both of which have charts that are reading a message quite loudly.
Bullish Charts
We will identify the screen that each chart comes from and then the charts that Pattern Finder identified.
» Bullish Charts; Multi-timeframe; Nearest Congestion or Trend
KTOS; both the 18-month and 3-year charts show more upside room to nearest resistance or congestion than downside room.
18-month chart
Uptrend; upside target 15.3% higher; downside target 6.5% lower.

3-year chart

» Bullish Charts; 3-yr Charts; Nearest Congestion or Trend
AGL; Uptrend; through trend resistance; upside target 35.3% higher; downside target 1% and then 8% lower; possibly topped out.

» Bullish Charts; 3-yr Charts; Trend Support and Resistance Lines
This screen only looks at trend resistance and support, and disregards congestion lines.
DAO; ‘walking up support;’ up trend, building off of a prior ascending base; gap to fill.

NVDA; ‘walking up support;’ up trend, room to all time high and trend resistance for an extension.

Bearish Charts
Here too, we will identify the screen that each chart comes from and then the charts that Pattern Finder identified.
» Bearish Charts; Multi-timeframe; Nearest Congestion or Trend
TS; both the 18-month and 3-year charts; down trends, more room to downside support or congestion than upside.

» Bearish Charts; 3-yr Charts; Nearest Congestion or Trend
DB; down trend; through support congestion.

OVV; downtrend; more room no trend resistance than back up to congestion.

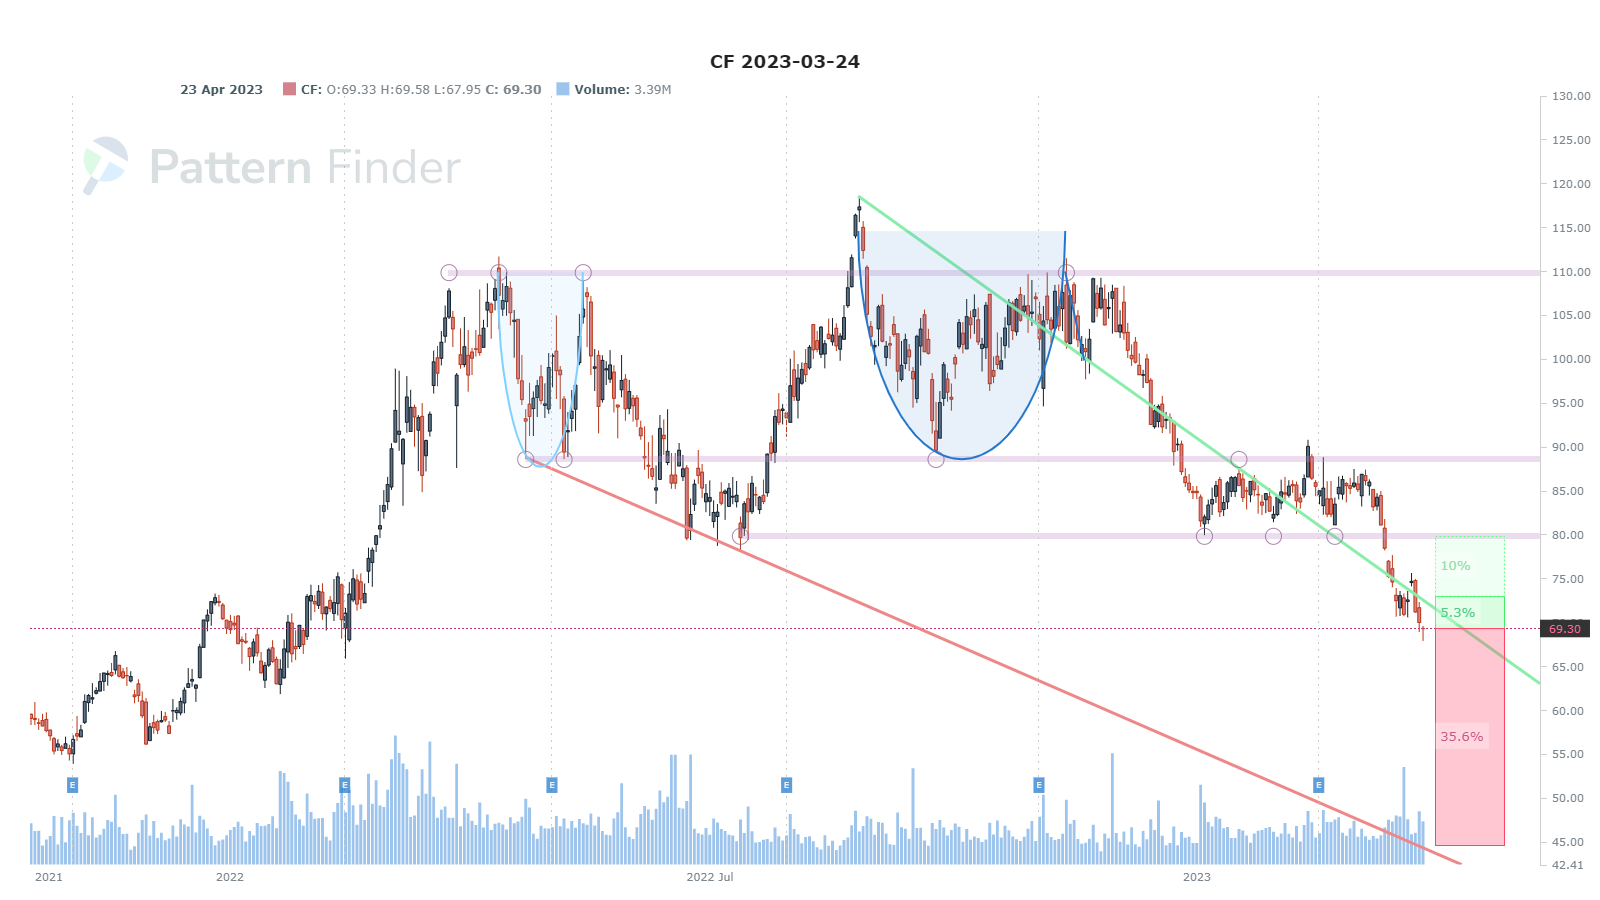
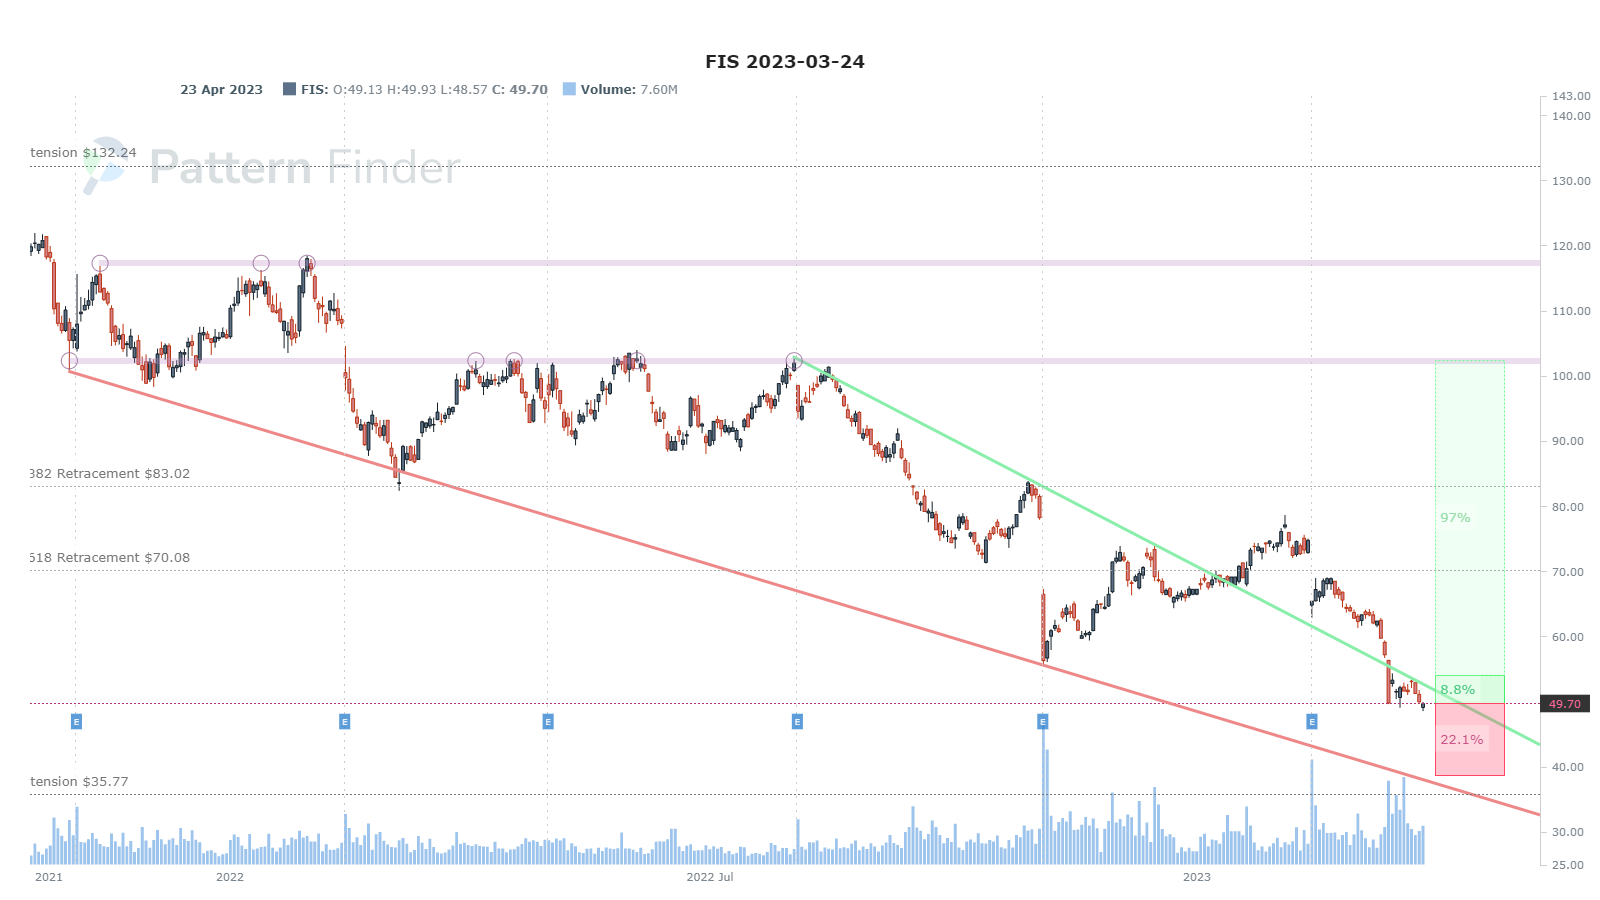
» Bearish Charts; 18-mo Charts; Trend Support and Resistance Lines
CF; down trend; down channel; failed to turn prior resistance into support; more room to downside support than upside resistance.
FIS; down trend; down channel; failed to turn prior resistance of lower highs into support; more room to downside support than back to resistance; coincidence of support (red line) with Fibonacci retracement (dotted line).
RNG; down trend; down channel, right at prior point of support; more room to downside than upside (this is a log chart).

And finally, we turn to the indices for comment.
Indices
The SPX is in a wedge (constricting) channel (lower highs and higher lows). This creates a tightening trading range which eventually breaks out and that breakout can be abrupt - higher or lower.
Note how the trend resistance line (green) and the trend support line (red) will intersect, possibly creating a moment of breakout.

We turn to the Russell 2000 small cap index through the IWM ETF.
IWM has fallen through support, and although chartists tend to “draw with crayons” as one trader told me, it would have to be a pretty thick crayon not call small caps in a bad spot.

Conclusion
Buckle up for volatility - that’s how SPX reads, and buckle up for downside pressure is how IWM reads.
To profit in this world, two sided trading may be required. That’s bullish and bearish.
CML Pattern Finder is the answer. It takes the guesswork and time out of understanding stock charts and screening for traders.
Transform a standard stock chart into a trading plan — instantly.
You have to experience it to believe and experience is just a free click away through a video below.
Leverage the market like a pro, and keep leveraging it, all for less than $1 a day.
We are offering a huge discount on this page: Pattern Finder: The Next Era of Charting.