


Several Bullish Tech Charts into the Fed


Lede
Today we will remain sector specific: tech is on our mind heading into the Fed’s decision.
Preface
The market will likely move on the Fed’s decision and commentary post meeting. The move may be sector specific, with certain areas ding better than others.
The post today is a focus on tech; not because we are staking a claim on a tech rally, but because if there is a tech rally, we can identify charts with strength ahead of time. Either way, all of these stocks could move in unison, for better or worse, tomorrow.
Bullish Tech Charts
For all of these charts, we are letting Pattern Finder draw in the following:
» Congestion lines in pink
» Trend support in red
» Trend resistance in green
» Various patterns
» The PnL zones for a long trade
For a quick 30-second demonstration of how we are getting Pattern Finder to do this, you can watch the video below, then move on to the rest of the chart analysis.
If you’re not into the video, breeze on by it.
These charts are presented in no particular order, but each of them will have a larger distance to the next upside target (reward) than distance to the next downside target (risk).
We will use sentence fragments to discuss the finer points.
» PANW
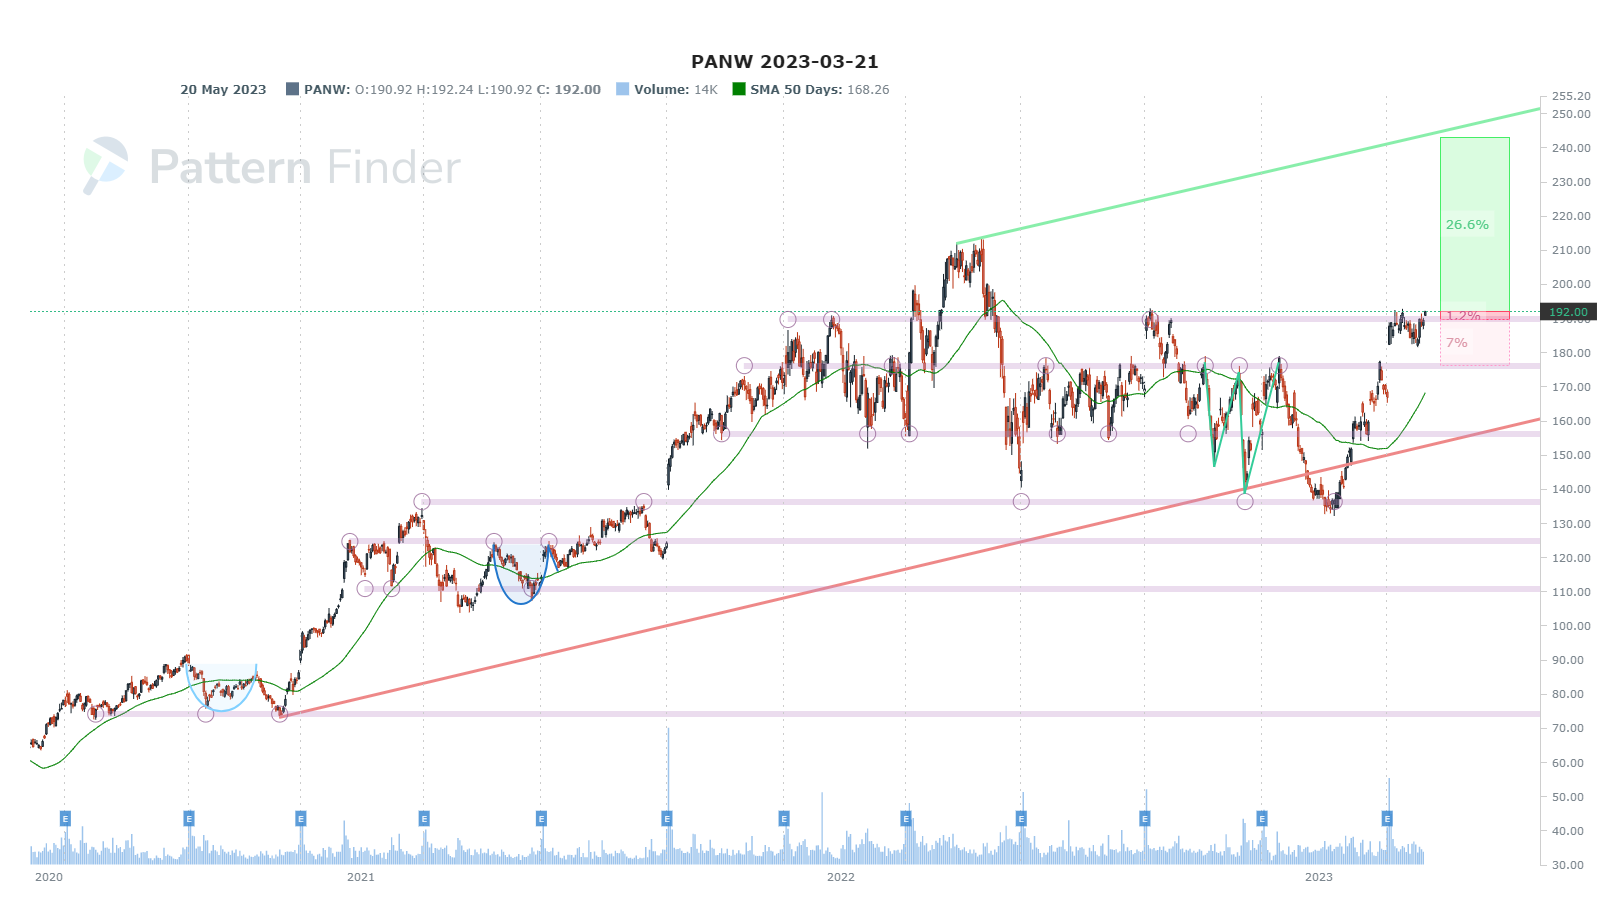
At congestion;
Gap filled;
Room to resume up trend of higher highs
Rising 50-day simple moving average (SMA)
Loss zone: ~$178
Profit zone: ~$240
And we zoom in:

» CRWD

Through trend resistance (green line)
Up trend
Stretch upside target the base of a prior ascending base (yellow line)
Loss zone: ~$120
Profit zones: ~$150; ~$170; ~$180
We zoom:

» AMAT

‘Walking up support’
Higher lows
At reinforced congestion from a double bottom
Loss zone: ~$120
Profit zone: ~$140
We zoom in:

» ALTR (again)

‘Walking up support’
At congestion from a prior cup
Loss zones: ~$68, ~$62
Profit zones: ~$77, then a possible runner.
We zoom in:

» META (again)

Up trend
Gap filled
Perhaps at a double top if it fails here
Another large gap to fill starting at ~$240
Loss zone: ~$180
Profit zone: ~$235, ~$242
We zoom in:

» OKTA (again)

Up trend
‘Walking up support’
Inside a prior gap down
Loss zone: ~$73
Profit zone: ~$110
We zoom in:

» AMD
This one actually does not have a proper set-up but it’s worth discussing.

Up trend
‘Walking up support’
But… right at multi-point congestion: bottom of a cup and top of a cup with handle.
Loss zone: ~$85
Profit zone: ~$130
We zoom in.

Next Steps
You can do this yourself; it takes about 3 seconds per chart, if that. Screens find the charts to look at if you don’t have your own watchlist.
We are offering a huge discount on this page: Pattern Finder: The Next Era of Charting
Thanks for reading, friends.