

SPX Before the Fed - Critical Levels
SPX Before the Fed - Critical Levels


Lede
Today we do a quick post on the S&P 500 (SPX) before the Fed decision on rates and perhaps more importantly, the press conference which tends to lead to fireworks.
Tomorrow we will get a bit spicier, with industries doing the best and worst after the news today, and then individual names breaking through resistance and support, along with fresh heavy buying volume and selling volume down to the stock level.
S&P 500 (SPX)
As we have written over the last few weeks, the 5-year chart for SPX shows the index on critical support whereas the 3-year (and 18-month) chart shows the SPX at resistance.
The various time frames agree that SPX is at a crucial level.
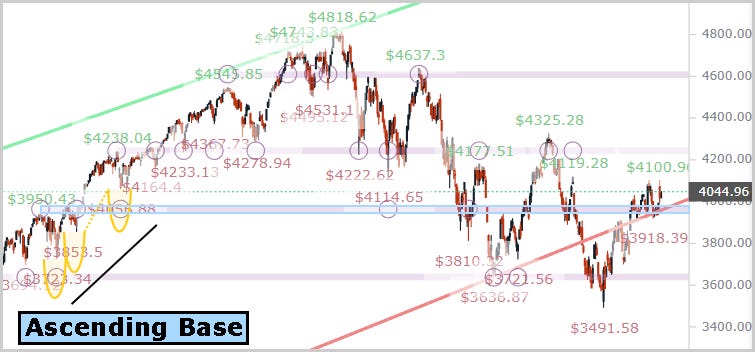
We start with the 5-year chart.

Pattern Finder automatically draws in the ascending bases (two of them), the congestion lines (pink lines) which act as short term support and resistance, and finally both trending support (red line) and trending resistance (green line).
The index is right at support and… right at the same price where an ascending base ended.
Next we zoom in.
The support level is clear and the Fed holds the keys to car that will drive the index.
We next flip to the 18-month chart, with all of Pattern Finder’s fixings automatically drawn in.

This points to a similar conclusion that the SPX is at crucial levels.
Upside would be to the pink congestion line above trend resistance at about 4250 and the downside is... all the way down to 3600.
We can see that the index has experienced a series of lower highs, making upside moves essentially failures over the non-trivial period of time.
We zoom in for convenience on this chart as well.

Mr. Powell, let us know where we're headed.
Tomorrow, we dive deeper in specific names — a lot of them.
Conclusion
We truly hope you are enjoying using Pattern Finder and our posts and see how easy it is to improve your trading.
Become a member of Pattern Finder, if you so choose, at the link below:
Thanks for reading, friends.