


Stock Charts - What if there was magic? What if it wasn't magic?

Preface
We have spent a fair amount of time discussing the intersection of a bullish chart set-up, with bullish return distribution characteristics, and how that has translated into profitable option backtests.
We called the coincidence of a bullish chart with those return characteristics and then with bullish sentiment a bullish entanglement.
We do so again today, but we follow the logic through three companies - all three with bullish charts, two with bullish entanglement and one without and how vastly impactful that is for option traders, and therefore stock traders.
Bullish Charts - Some Entangled
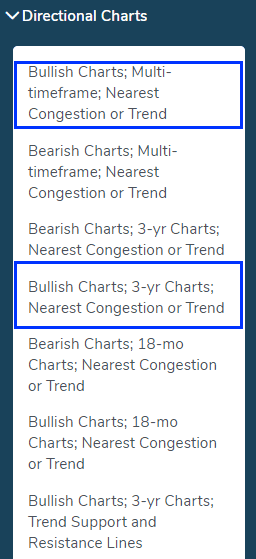
The bullish chart part of the methodology starts with Pattern Finder, and the Directional Charts section of the screener and then we use two of them today, highlighted in the image below.
We start with ticker DDOG.
We can see that the stock is right at the trend resistance line (green line), has hung out there for a while, and may have room for that next congestion line (pink line), about 21% higher, whereas a failure would stop out about 10% lower.
That’s the bullish set-up we want Pattern Finder to screen for us, and it has.

Alright, next we turn to the characteristics of the stock return versus the S&P 500 over the last year.
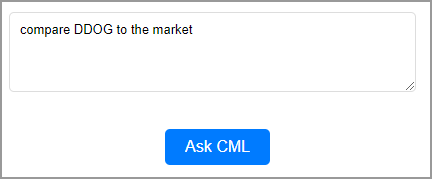
We start by asking our AI to compare DDOG to the market. This will soon be exclusively available at an unlimited level to Pattern Finder and TradeMachine members.
We focus on two pieces: (i) the ‘kurtosis,’ which is stats speak for ‘fatness of tails,’ and (ii) the ‘skew’, which is stats speak for asymmetry of returns.
See below that both the upside kurtosis and upside skew are larger than the downside kurtosis and downside skew.
We have circled the green numbers and red numbers to explicitly identify the comparison we are making

It’s beautiful. While the stock has actually unperformed the market 13.4% versus 15.7% over the last year, the distribution characteristics are what we’re after to find edge and if someone isn’t now talking about that in this area, then they aren't talking at all.
We finally get the sentiment reading for DDOG from our AI as well.

And the results:
News Sentiment
The news sentiment rating for DDOG is 70, which is somewhat bullish. The headlines suggest that Datadog is expanding its cloud cost management capabilities, launching workflow automation for faster issue remediation, and introducing new capabilities to help Azure organizations manage costs, migrate to the cloud, and monitor AI models.Additionally, there are articles recommending Datadog as a good investment opportunity.
While there is some uncertainty about whether it's too late to buy Datadog stock, overall the news seems positive and suggests growth potential for the company.
Final Sentiment Score Adjustments
- Over the last 30-days, the volume on up days was 3.3x higher than on down days so I have adjusted the sentiment up.
- Three month RS (relative strength) is 95 out of 100. A value of 90 or above indicates stronger sentiment, so I have adjusted the sentiment score up.
- The final sentiment score I computed was 79 with a 9 point adjustment beyond news.
We see a final sentiment score of 79/100, which is bullish and now we have that coinciding with a bullish chart, and bullish return characteristics.
We have trademarked that as Bullish Entanglement(™).
Alright, hypothetically this should have led to very strong returns in the option world, not by being bullish, nah, more like being “not bearish.”
And here is the 1-year backtest of simply selling a weekly out of the money put spread in DDOG while never trading earnings.

We only show some selected data to simply the discussion - the trade had a 69% win rate and a total return (including margin requirements) of 133%.
This for a stock that actually underperformed the market.
It’s magic (no it’s not, it’s the tools).
We do this same process for ticker EXAS, identified by the same screen in Pattern Finder.
We start with the stock chart (that’s the methodology).
We see a stock that has “walked up support,” which happens with a series of higher lows and a stock that rises at that pace or faster.
We see two upside targets, each about 10% higher and a downside stop of 2% or another 8% lower.
That’s the bullish chart we want and are delivered.

Next we ask our AI for the tail analysis.
We aren’t going to share the entire images of the next step - distribution characteristics - just the part we focus on:

EXAS has the characteristics we want - a stock return distribution when compared to the market that leans to the upside (upside skew is larger than absolute downside skew) and upside kurtosis is larger than downside kurtosis, which means big surprise moves are larger on the positive side than the negative side.
Finally we ask our AI for the sentiment:
The news sentiment rating for ticker EXAS is 70, which is somewhat bullish.
The headlines suggest that Exact Sciences is on a hot streak and nearing a profit-taking zone, and that it is a top growth stock to buy and hold for 10 years. Additionally, Exact Sciences is presenting new long-term patient outcomes in multi-cancer early detection and breast cancer recurrence testing at ASCO® 2023, which could be seen as a positive development.
The only headline that could be seen as neutral is that Exact Sciences is participating in June investor conferences, as it doesn't provide much context.
Overall, the headlines suggest that Exact Sciences is a strong growth stock with positive developments in its cancer detection technology.
Final Sentiment Score Adjustments
- Over the last 30-days, the volume on up days was 2.3x higher than on down days so I have adjusted the sentiment up.
- Three month RS (relative strength) is 93 out of 100. A value of 90 or above indicates stronger sentiment, so I have adjusted the sentiment score up.
- EXAS's short- and long-term moving averages are stacked with the 10-day above the 21-day above the 50-day above the 150-day above the 200-day moving average. When the shorter-term averages are above the longer-term ones, it generally indicates that current sentiment and price action are more bullish. I have adjusted the sentiment score to reflect this symmetry.
- The final sentiment score I computed was 85 with a 15 point adjustment beyond news.
That’s pretty cool that it decided to look at whether or not the moving averages are stacked (which apparently they are!).
A final score of 85/100 is definitely bullish sentiment and we have our bullish entanglement with (i) a bullish chart, (ii) bullish distribution characteristics, and (iii) bullish sentiment.
So… hypothetically this too should have been a successful candidate for a “not bearish” option trade over the last year and it was according to TradeMachine:

Alright, next we turn to our final stock from those same Pattern Finder screens: NCLH.

The chart looks great - Pattern Finder has done its job.
We see a stock ripping higher, and now through a crucial congestion line (pink line), with 20% upside to the next bullish target and a super tight stop at about 3% lower.
But, there is an issue with NCLH that DDOG and EXAS did not face: the distribution characteristics are not favorable.
We ask our AI for the tail analysis and we share just the piece we are focusing on:
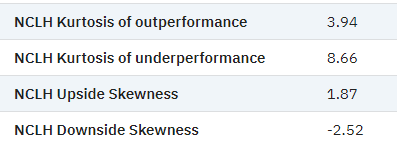
Uh, oh. The kurtosis and skew favor the downside rather than the upside.
As for sentiment, we did ass that test. A snippet from our AI reads this:
The final sentiment score I computed was 80 with a 15 point adjustment beyond news.
NCLH stock is up 52% in the last year versus the S&P 500 up 15.7%; so this stock should have been an awesome trading vehicle for a “not bearish” option trade, right?
So… does that skew and kurtosis stuff really matter?
You tell me.
Here are the results of the backtest of the same option strategy, and this time we include our prior two tickers so the side by side comparison is easier:

Yep…
NCLH turned a loss using a “not bearish” option strategy, even though it has more than tripled the market in stock return.
DDOG on the other hand underperformed the market but returned 133% with this same option strategy.
How is this possible?
It’s return characteristics .
And if you’re starting to get the sense that trading without these return characteristics is like trading blind - you’re right - it is.
Why look for a black cat, in a dark room, that isn’t even there, when the light of day is rightfully and easily yours?
Don’t trade in the dark.
Conclusion
Kurtosis and Skew for backtesting is coming to TradeMachine in 16 days.
Kurtosis and Skew for screening in Pattern Finder is coming to TradeMachine in 16 days.
Sentiment analysis will be inside both products as well.
The price for the products will rise when the new capabilities are available but it will not go up for grandfathered in members.
So, if you’re interested, you can learn about either or both products here:
We note that TradeMachine members gain access to Pattern Finder for just $11 / mo.
Thanks for reading, friends.
Legal
The information contained on this site is provided for general informational purposes, as a convenience to the readers. The materials are not a substitute for obtaining professional advice from a qualified person, firm or corporation. Consult the appropriate professional advisor for more complete and current information. Capital Market Laboratories (“The Company”) does not engage in rendering any legal or professional services by placing these general informational materials on this website.
The Company specifically disclaims any liability, whether based in contract, tort, strict liability or otherwise, for any direct, indirect, incidental, consequential, or special damages arising out of or in any way connected with access to or use of the site, even if I have been advised of the possibility of such damages, including liability in connection with mistakes or omissions in, or delays in transmission of, information to or from the user, interruptions in telecommunications connections to the site or viruses.
The Company makes no representations or warranties about the accuracy or completeness of the information contained on this website. Any links provided to other server sites are offered as a matter of convenience and in no way are meant to imply that The Company endorses, sponsors, promotes or is affiliated with the owners of or participants in those sites, or endorse any information contained on those sites, unless expressly stated.