


Stocks to Watch - Bullish Charts; Bearish Charts (GOOGL, AAPL, more)

Lede
Today we’ll look at a set of bullish charts from three different screens, one of which surprises us with GOOGL, and then a larger set up of stocks with RS (relative strength) breakouts.
Then we will look at a weakening AAPL chart and a broader set of stocks showing heavy selling volume and weak RS.
Note: The CPI (and Core CPI) report is out tomorrow so short-term trends could be broken on an aggressive market wide move.
Bullish Charts
For our first bullish chart, we used one of the directional screens in Pattern Finder and find ticker PSA.
We had Pattern Finder draw in the congestion lines (pink), trend support (red), trend resistance (green), and the target zones (red and green fill).
PSA is now, again, testing reinforced point of congestion.

The upside target here would be the next set of congestion points, about 11% higher, and the stop zone could be quite tight depending on the trader’s preference.
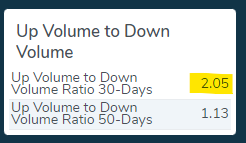
We then looked at GOOGL through the “Heavy Buying Volume” screen. GOOGL is showing more than 2:1 buying volume versus selling volume in the last 30-days:
And here’s the chart where we note that GOOGL is right in between the congestion points demarked by an ascending base:

We can zoom in for clarity and see a reasonable risk:reward dynamic should GOOGL breakout of its range and highlight the volume on the bottom of the chart as well:

Finally, we turned to the “Heavy Buying Volume on the Day” screen and see ticker SWAV.
The stock has moved higher on a favorable Medicare ruling and now the stock is right at the base of a prior cup.
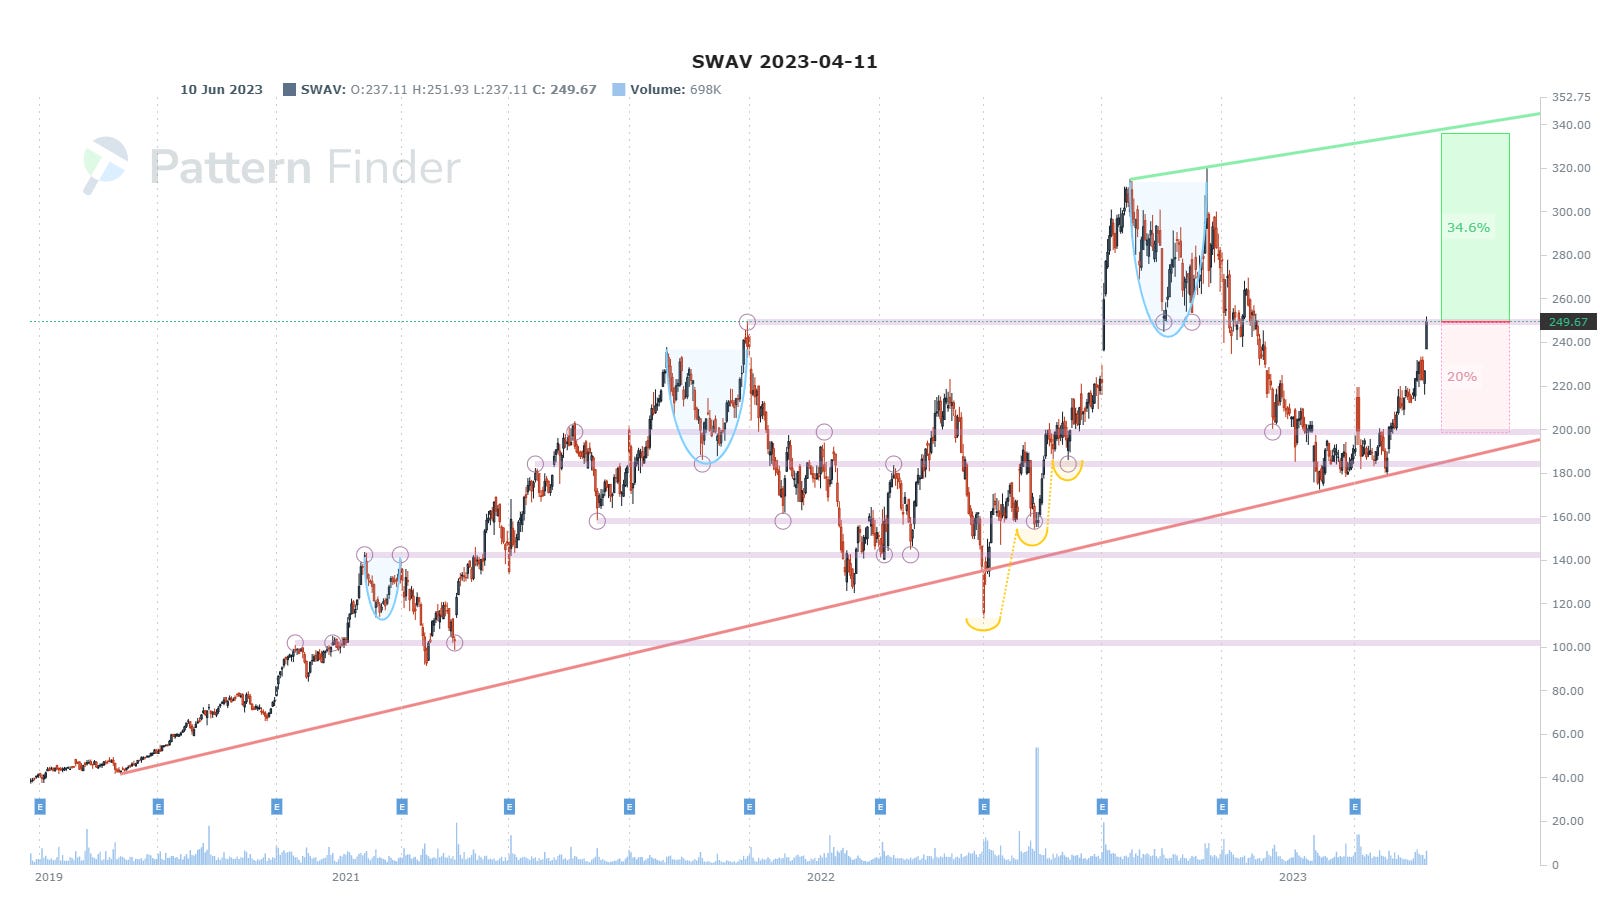
We can zoom in:

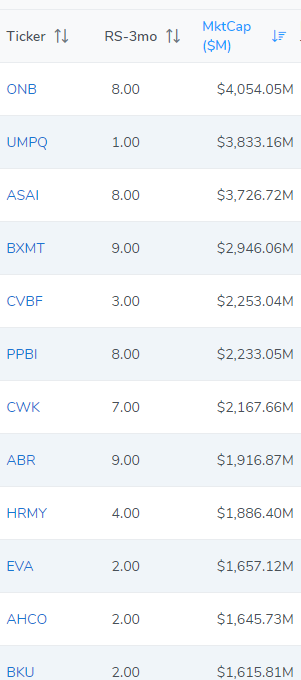
Finally, we list some tickers that show up on the “RS Breakouts” screen with market cap listed as well:

Bearish Charts
Since GOOGL showed up on the buying volume screen (over the last 30-days), we looked at AAPL, and see a rather different chart.
AAPL has a series of lower highs which we highlight in red, and while it’s early to call another lower high, there appears to be a trend forming.
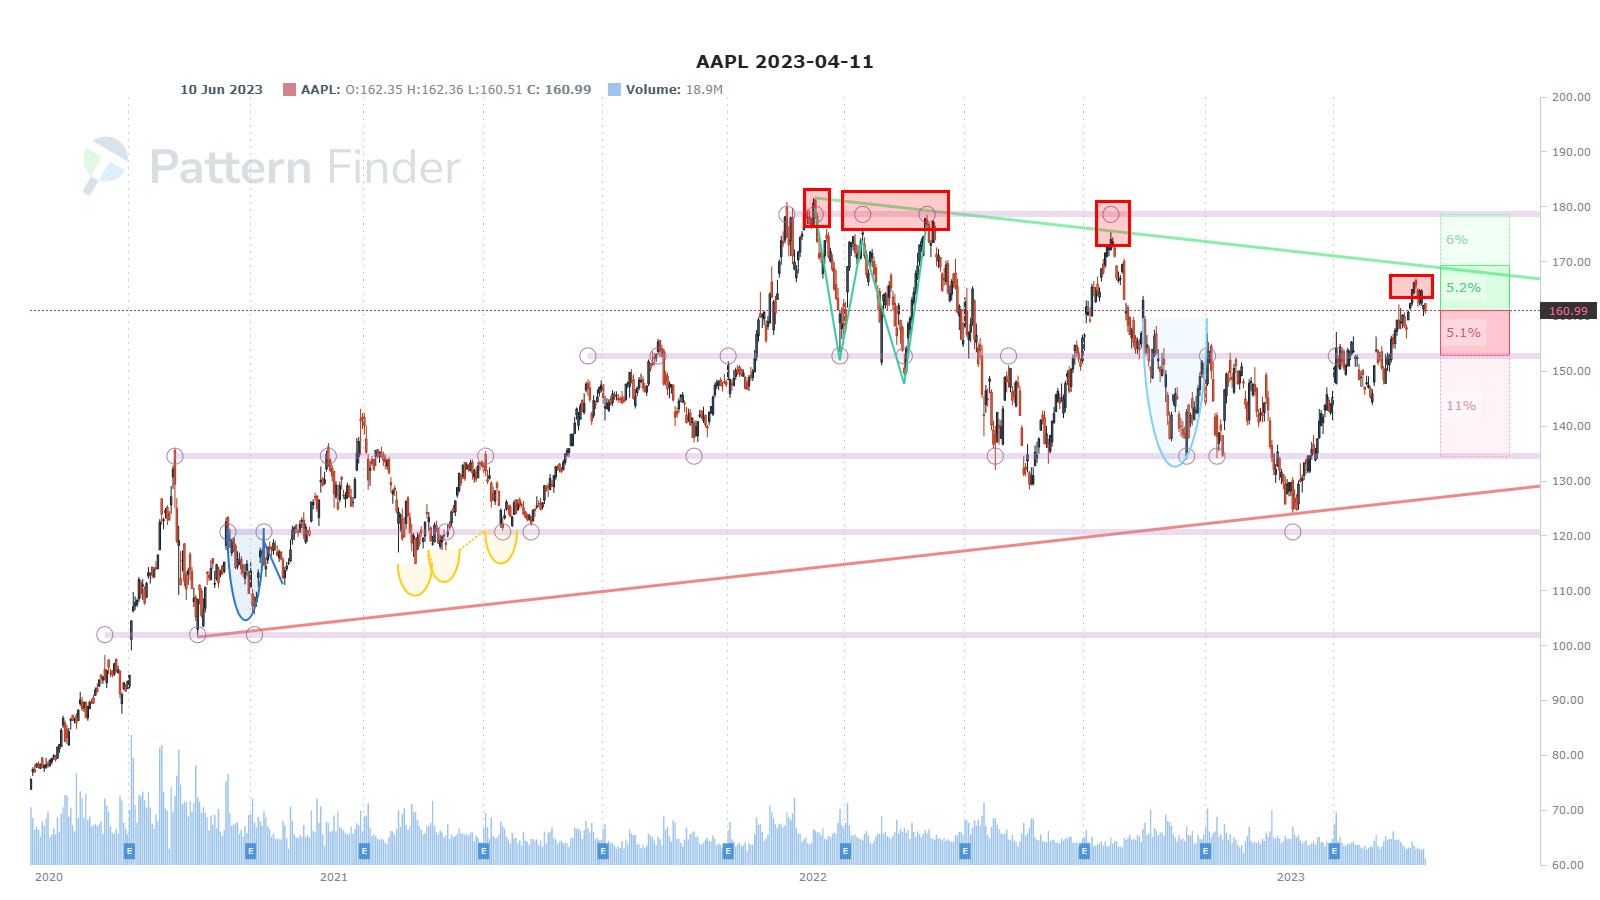
We can zoom in for clarity:

AAPL has that look of a trading range stock and this time on the down trend. Again, the CPI numbers out tomorrow and the market reaction to it could discombobulate this trend.
Finally, we list a group of tickers from Pattern Finder’s “Heavy Selling Volume” screen for traders to peruse:
Conclusion
You can do this yourself inside Pattern Finder; it takes about 3 seconds per chart, if that. Screens find the charts to look at if you don’t have your own watchlist.
We are offering a huge discount on the page below and some demo videos to explain the technology. Pattern Finder: The Next Era of Charting.
The final price of Pattern finder will rest about 5x higher than the introductory offer found on the page above - and that page locks in your low price.
Thanks for reading, friends.
Pattern Finder: The Next Era of Charting.