

Strength Here, Weakness There, Breakouts Elsewhere
Strength Here, Weakness There, Breakouts Elsewhere

Lede
Today we will look at four stocks from four different screens or pattern breakout results.
Pattern - Breakouts and Break Downs
We start by using the ‘Pattern Breakouts’ tab in Patten Finder and looked for a tech stock that might actually be doing… well.
We found ticker SRAD had broken through 18-month resistance and it has strong buying strength as measured by our proprietary “Buy-Sell Rating” which ranks all companies from 1-100.
A little definition never hurts:
Our proprietary rating for identifying buying and selling activity in a stock over the last 50-days. We use a proprietary formula which puts heavier weight on the shorter-term, to create a rank system where stocks that have heavy buy to sell volume, strong RS, and strong stock returns get a high rating and stocks with high sell to buy volume, weak RS, and weak stock returns get a low rating.
Here is the pattern breakout result

And here is the 18-month chart, where we allow Patten Finder to automatically draw in the congestion lines, trend support, trend resistance, and any CANSLIM patterns.
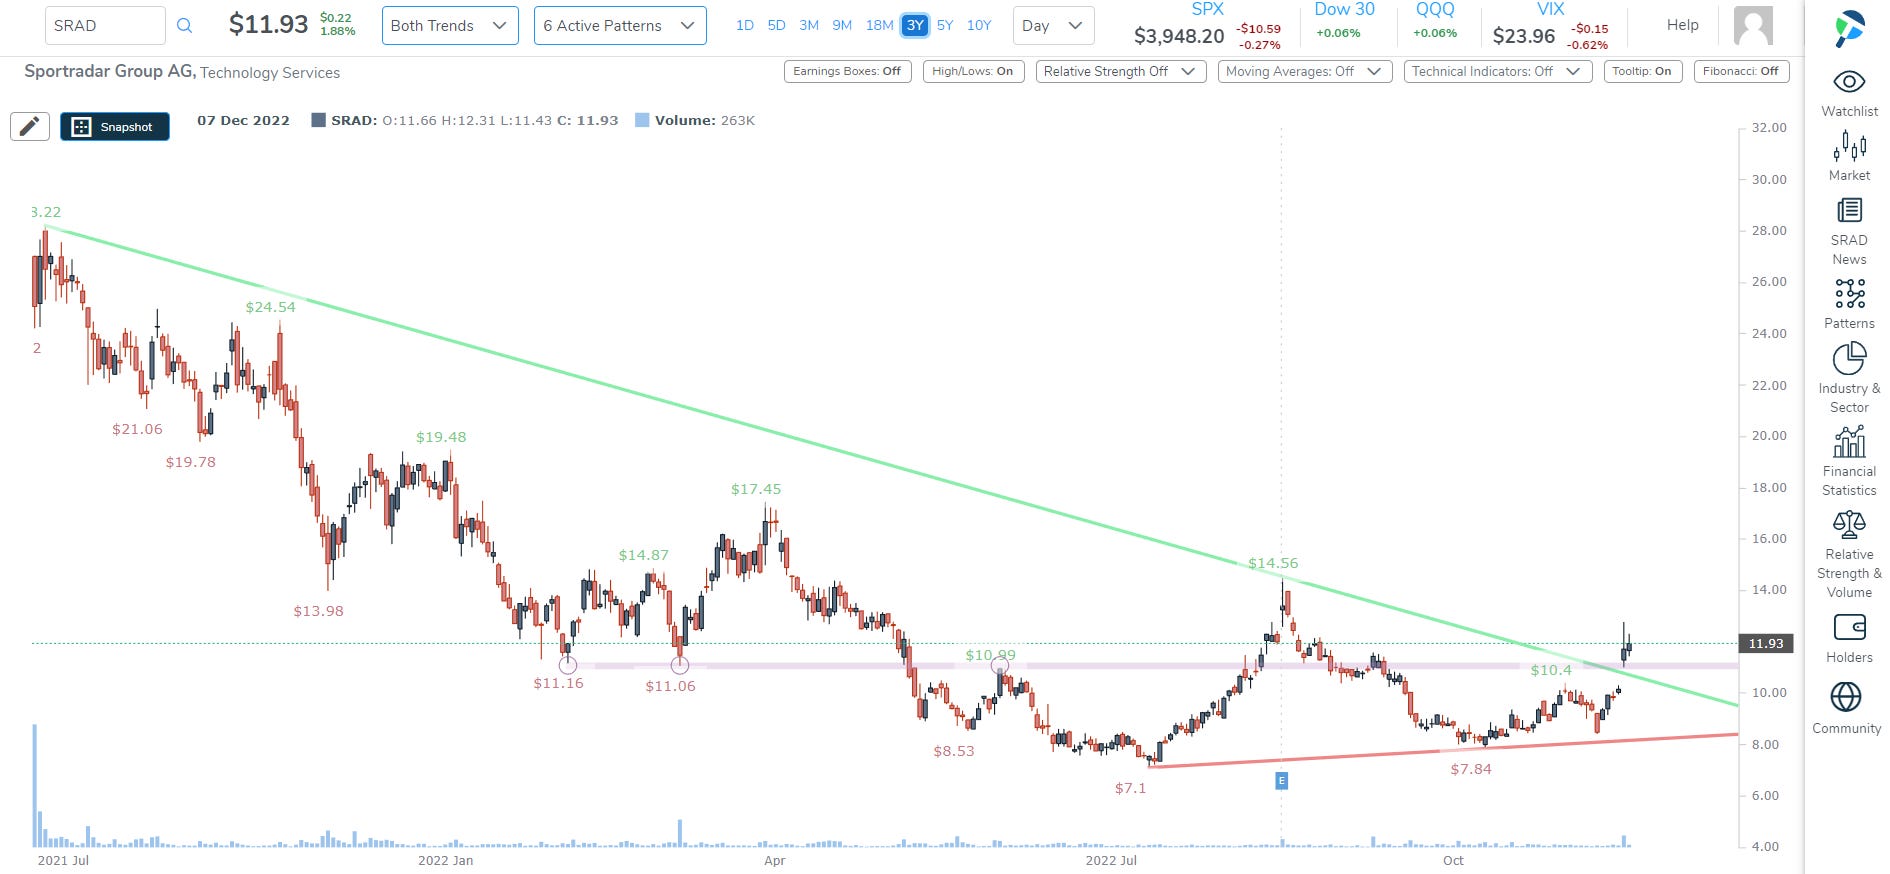
Indeed, we see not only a pop through trend resistance, and drawn by Pattern Finder, but also through the congestion line (the pink line).
The ‘why’ to the ‘what’ of the stock move is also in Pattern Finder, using the company news tab (it’s earnings).

Next, we turned to a pattern breakdown - through support, but staying in the tech sector.

Ticker ZI caught our eye for several reasons.
First, it has broken down through support, but also it has a Buy-Sell Rating of 1 (out of 100), literally the lowest value possible, with a 3-month relative strength (RS) of just 4 (out of 100) all while its EPS Rating, which is a proxy for fundamental strength is at 96/100.
That’s a wow. Here is the 3-year chart:
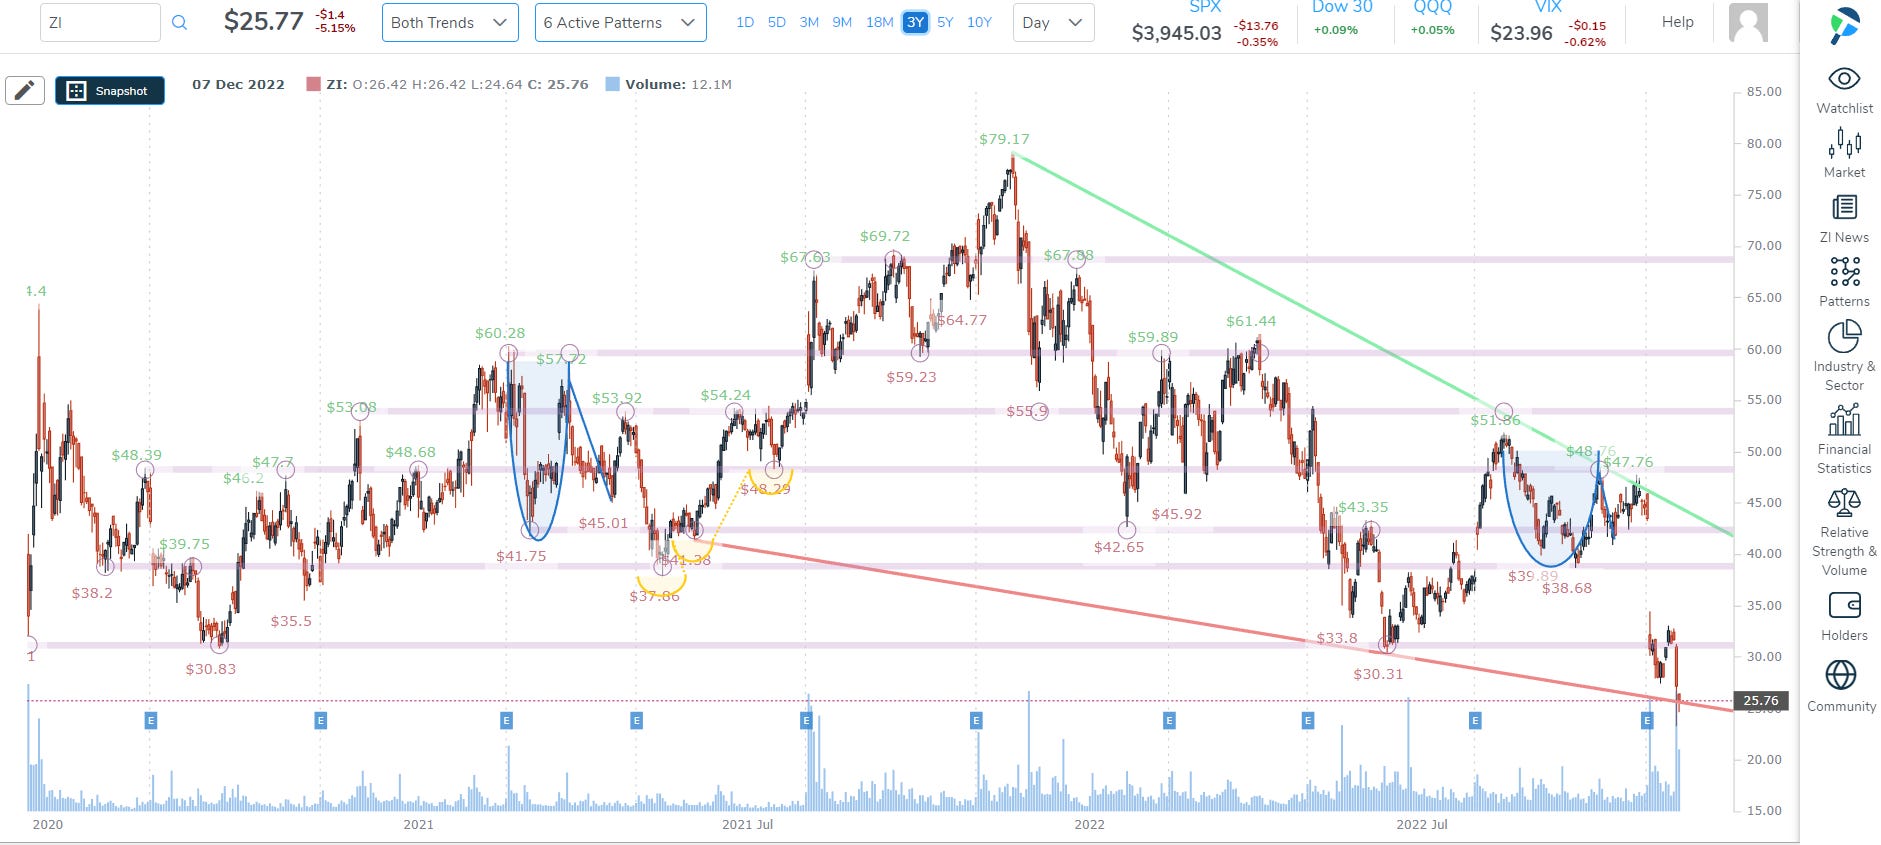
ZI collapsed off of earnings and ended a cup with handle rally.
The selling has been fierce (see the volume bars), and the stock is now right on the algorithmically drawn trend support from Pattern Finder.
We’ll leave the decision as to whether this selling is overdone, not done, or simply not interesting as a trade candidate.
Next, we moved beyond pattern breakouts to screen results.
Screens - Strength and Weakness
We started with our pre-built screen for “Bullish Heavy Volume on the Day,” which is a real-time screen for bullish volume and stock price.

Here are the actual filters:

Out of nearly 10,000 stocks in our universe, just four satisfy the requirements today, and we plucked out Macys (M). Here is the 3-year chart:
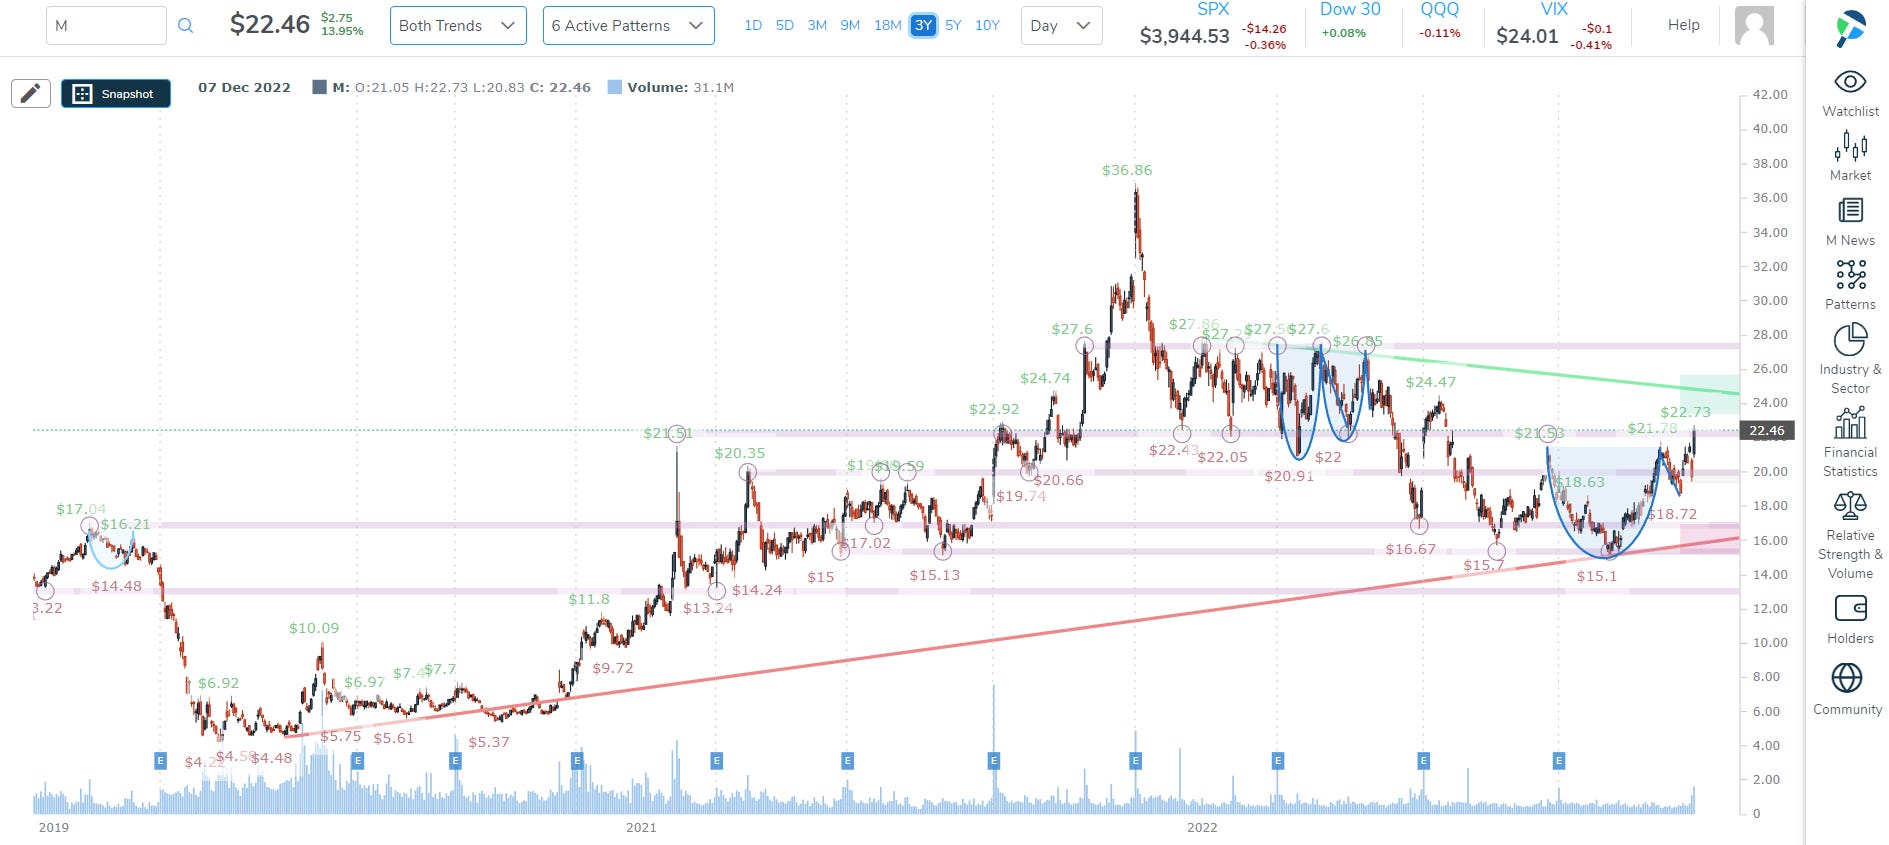
This is a great demonstration of Pattern Finder’s ability to help you trade.
Not only are trend support and resistance drawn in automatically, as are congestion lines (pink) and the CANSLIM patterns (in this case two cups and one cup with handle), but Pattern Finder also automatically drew in a profit zone (green shaded area) and loss zone (reed shaded area).
Macy’s is rising off of earnings results.
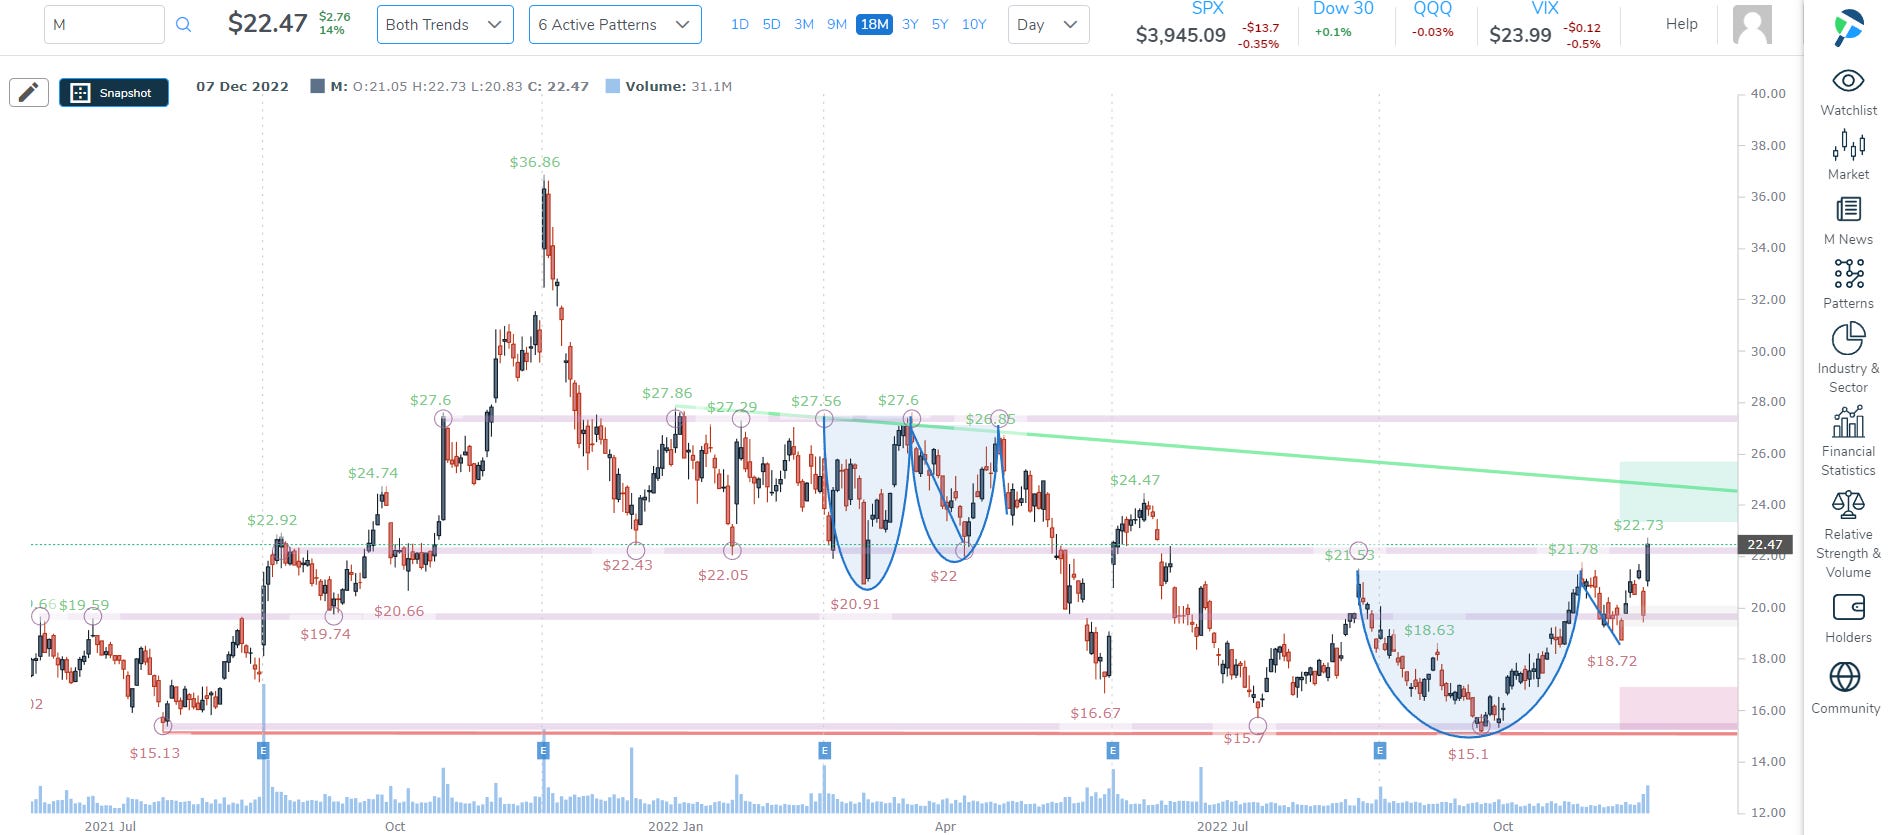
For a slightly more zoomed in look, we share the 18-month chart:
Finally, we wanted another approach to finding strength but not just for a day.
To do this, we used the pre-built ‘RS Breakout on High Volume’ screen, rather than build a new screen from scratch (which can also be useful).
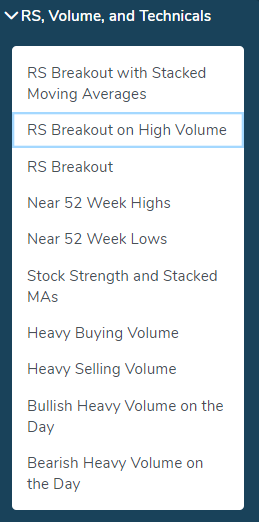
Here are the filters for the screen:

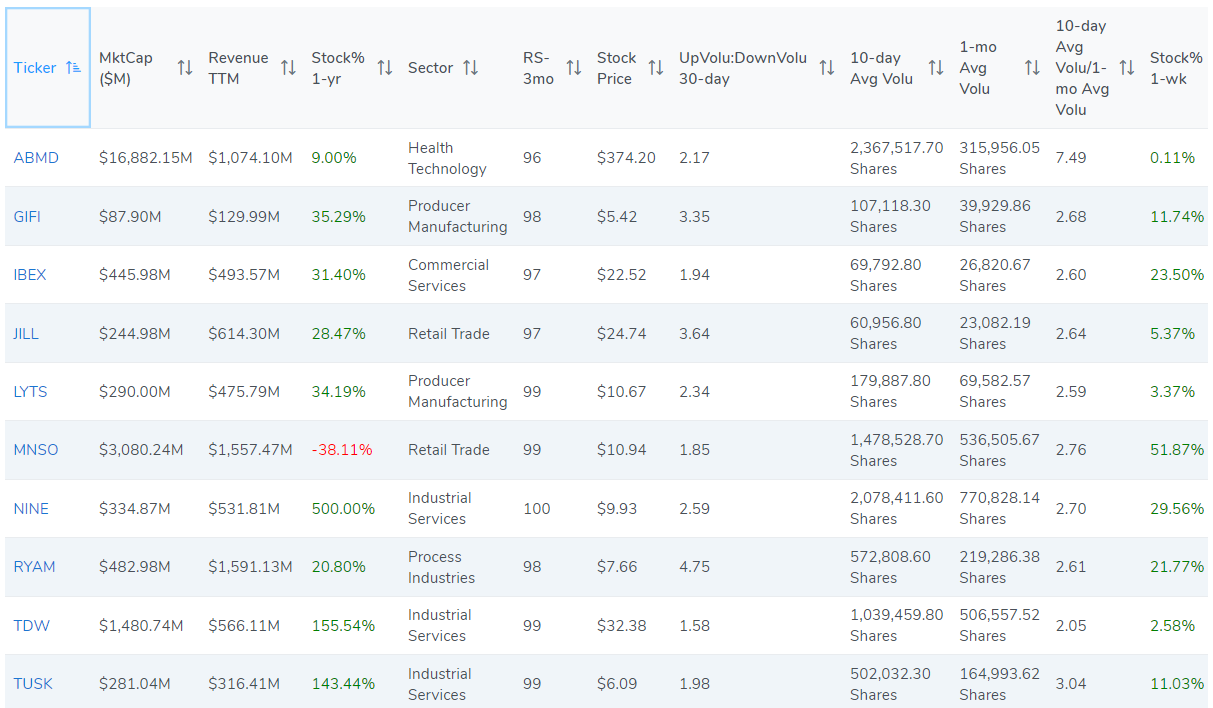
This time, out of our population of nearly 10,000 companies, we see just 10 pass the screen.
These companies have a short-term RS (relative strength) in the top 5% of all companies, while also showing at least twice as heavy buying volume to selling volume in the last 10-days and at least 1.5x as much buying volume to selling volume in the last 30-days.
For once, we share the list, and leave the chart analysis to you!
Conclusion
We truly hope you are enjoying using Pattern Finder and our posts and see how easy it is to improve your trading.
You can learn more on the page below, which includes two short videos (one for patterns and one for screening) and a very large discount. We think the pattern video is rather snazzy!
The page below also includes the video ‘How to use Stock Charts in 5 Minutes’ so whether joining Pattern Finder as a member or not, hopefully there is some value to visiting the page: Learn about Pattern Finder
Thanks for reading, friends.