


Strong EPS Rating and Three-Month RS
$CRWD $PLMR

Lede
Today we will introduce the Patten Finder EPS Rating and then scan for two charts: one with high 3-month relative strength (RS) and one with weak three-month RS. We end up with an insurance company and a tech darling and two decisions.
EPS Rating
The EPS rating is defined as follows:
Our proprietary rating for EPS strength. Stocks are scored 1 to 100 scale (100 being best) comparing a company's earnings per share growth with all other domestically traded companies in our database. The EPS rating combines annual changes going back five-years, free cash flow margin, and even revenue growth and forward revenue growth, although the revenue measures are weighted half as much as the various EPS measures. In total, we incorporate 16 metrics into the rating, 12 are EPS focused, 2 are FCF focused, and 2 are revenue focused.
We then created a screen which makes use of the EPS rating, and a few other additions:
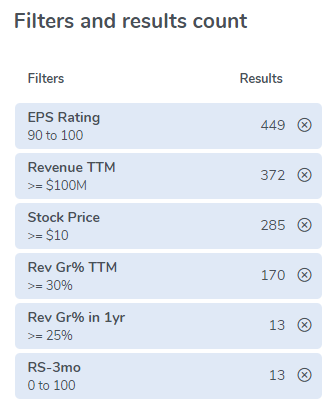
We are left with 13 companies that have an EPS rating greater than 90, have revenue in the trailing twelve months (TTM) of at least $100 million, a stock price greater than $10, revenue growth TTM of at least 30%, and finally, analyst estimates for at least 25% revenue growth next year.
Choosing Two - RS Strength and Weakness
We started with a strong 3-month RS company out of the 13 results:

Palomar Holdings, Inc. operates as an insurance holding company. The firm focuses on the residential and commercial earthquake markets in earthquake-exposed states.
Here is a snapshot of the ‘Financial Statistics’ tab for PLMR; but we don’t share all of the data (it’s too long for a post):

And finally, the stock chart:

The trend support (the red line automatically drawn by Pattern Finder) starts at the COVID low and passed through three other established lows in 2022, including the bottom of a cup:

Trend resistance (the green line automatically drawn by Pattern Finder) starts at the multi-year high and passes through the next local high. When drawn to the current day, the stock price is right on top of it.
Here is the start of the resistance line:

And here is where PLMR stock rests, right now:

If we back out a bit, the price today was a local peak before:

So, why show this stock chart?
This is an example of a company with strong fundamentals and short-term relative strength but may have already hit its profit zone for a swing trade.
No matter how good the screening is, traders can use the charts for the final analysis.
For the trader that wants to ride this momentum and feels that a break through resistance is coming, the profit zone would likely be the prior local peak at $115, while the stop (loss) zone could be the rising 50-day SMA (the blue line).
I have drawn in the green and red boxes for profit and loss zones.
This is a choice for the swing trader — is RS more or less important than the overall market trend?
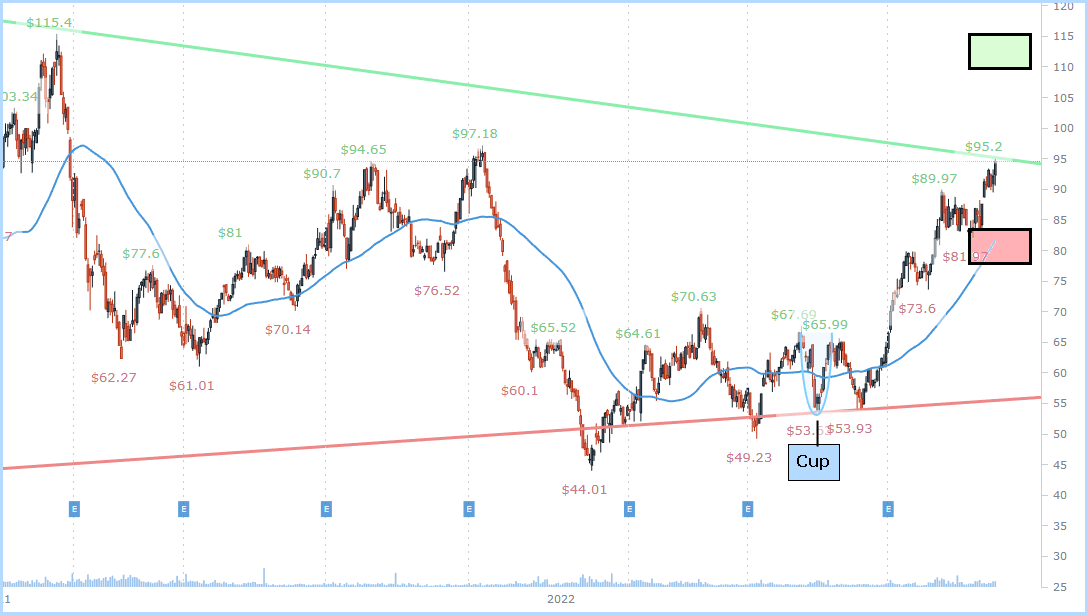
Next we turned to a stock that made it onto this list of 13, but this time with low 3-month RS: CRWD.
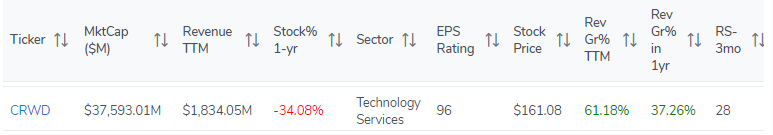
CRWD meets all the criteria for this rather tightly focused screen, but its RS is low.
Let’s look to the chart and do another dissection:

The algorithmically drawn trend support (red line) starts at the COVID low, and passes through the recent lows in June 2022:

We can see that the current price is right on support. So, here too the swing trader has a decision to make: is a bounce left in this tech darling with strong earnings or is the market sentiment too poor to make a speculation on a bounce?
What’s Next
We will continue to share charts, screens, and short discussions over the next few weeks before the CML Pattern Finder product becomes available in late October.
The product will have everything IBD MarketSmith® has, a lot more, like algorithmically drawn support and resistance trend lines, built with better, faster, more flexible, and more responsive technology.
It allows for additional technical signals beyond just those offered by the CANSLIM methodology, far richer fundamental screening data, but…
… it will cost 70% less. Yes, 70% less.
Stay tuned to this channel.
Thanks for reading CML Pattern Finder.