


The Monster Green Candle Today; Energy and Mega Tech

Lede
Today we examine the monster green candle that lifted the SPX off of what started out as a large down day due to CPI (and Core CPI) data. We then look for possible bounces in strength in ‘Energy Minerals’ and then AAPL and GOOGL.
SPX - Monster Candle
The S&P 500 started down off of inflation data and then the buyers piled in during a 30-minute push (for now). Here is an intra-day chart:

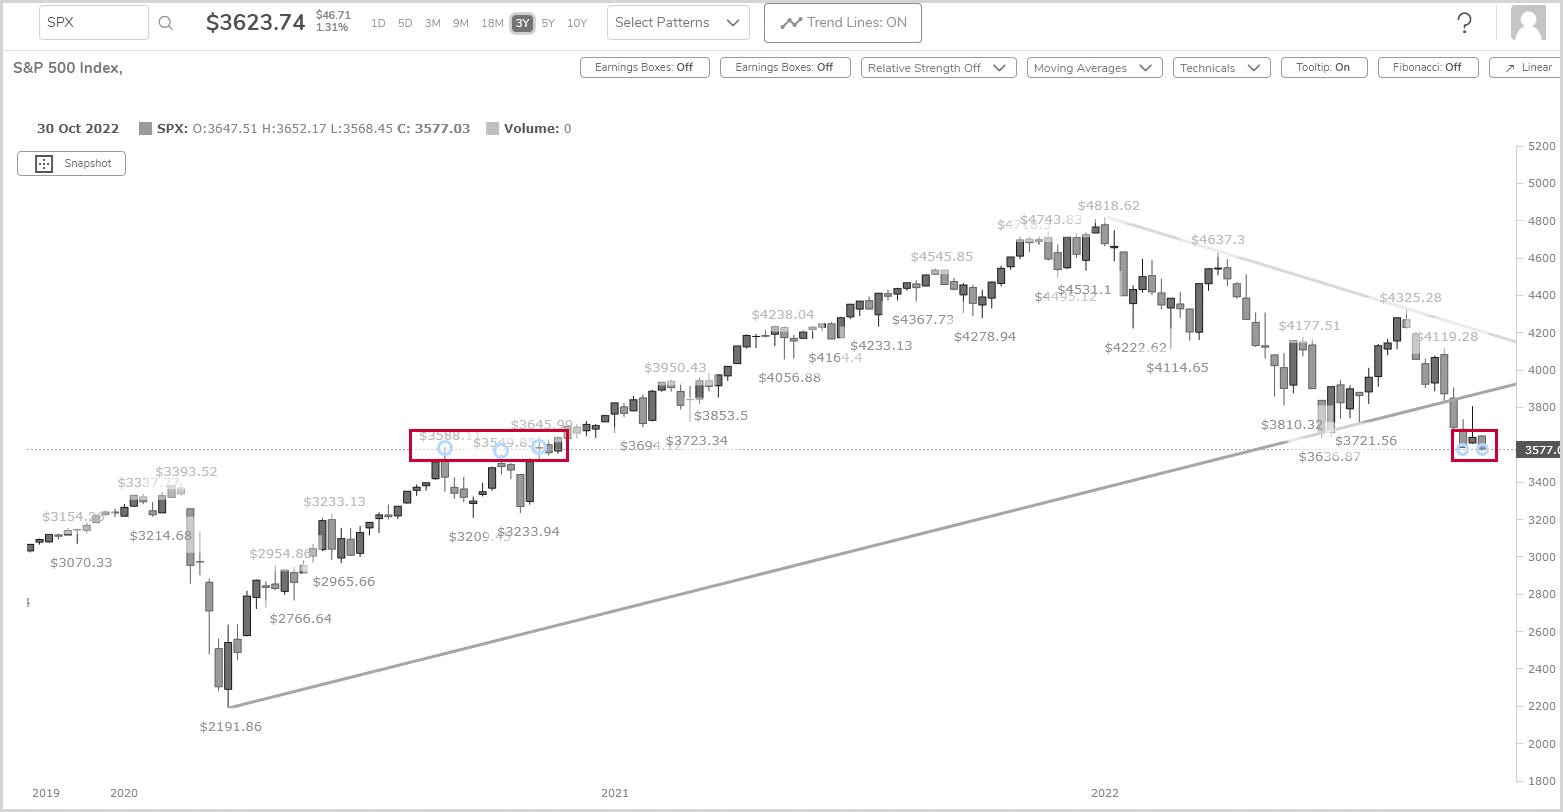
Where does that leave us? Here is a 3-year SPX chart from Pattern Finder with the algorithmic trend support (red line) and resistance (green line) turned on.

As Pattern Finder sees it, SPX is still in technical failure and the bounce today has not reversed the trend.
We then zoom in, turn the chart into black and white, and mark it up ourselves. The bounce price today did come off of previous congestion:
We can add horizonal lines (coming soon to Pattern Finder):

If this level doesn’t hold, SPX could see another 10% leg down and the current support isn’t exactly inspiring.
But, there was a bounce, so some names, a lot of names, were bought. Let’s find those in a screen.
Screen for the Pops
Here is the screen and how the population shrinks per requirement.

We were left with 7 companies, and we share some:

We see the top three results are Energy Minerals companies with strong one-year returns and 3-month relative strength (RS).
Here is PBF:
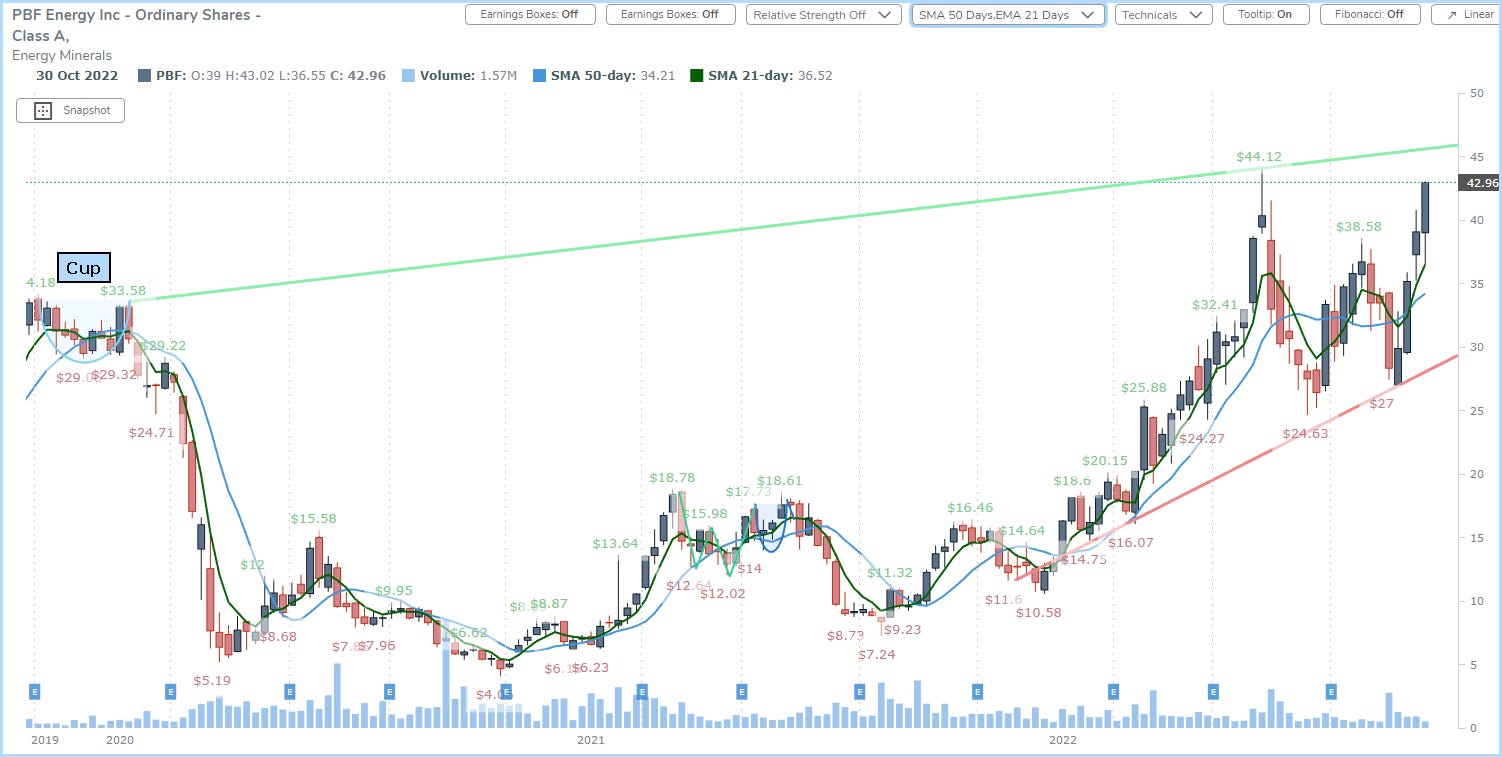
That’s a good looking chart with higher lows and higher highs. When we zoom in we can target profit and loss zones (hypothetically):

The stock is rising off of the 13-day EMA (dark green line), and saw that large candle today when SPX buyers came in.
A swing trader might have a profit zone at the top of trend resistance (green line) and stop out at the rising 13-day EMA.
We can also pluck CIVI off the screen results:
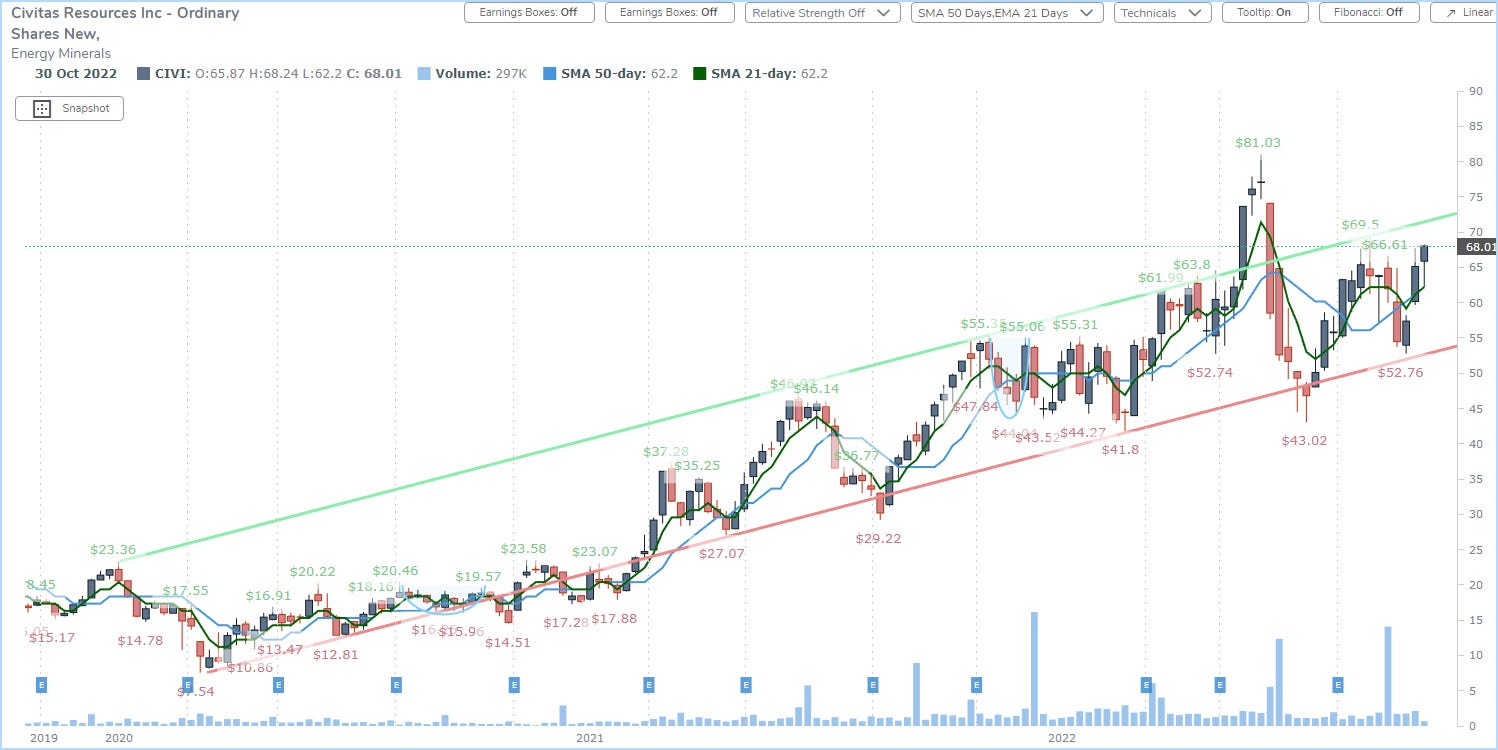
This is a rather similar chart. Here is a zoom:

Like PBF, we see the candle with SPX buyers pushing the stock above the 13-day EMA, with room for a profit and loss zone.
Finally, let’s turn to mega tech.
Mega Tech - Not Yet Inspiring
We’ll start with AAPL and an 18-month chart:

The trend support (red line) start at the end of an ascending base, passes through two other lows in 2022, and finds AAPL right there, today. If this low holds, it would be a higher low for AAPL (which also has lower highs).
Inspired to trade?
And finally GOOGL:
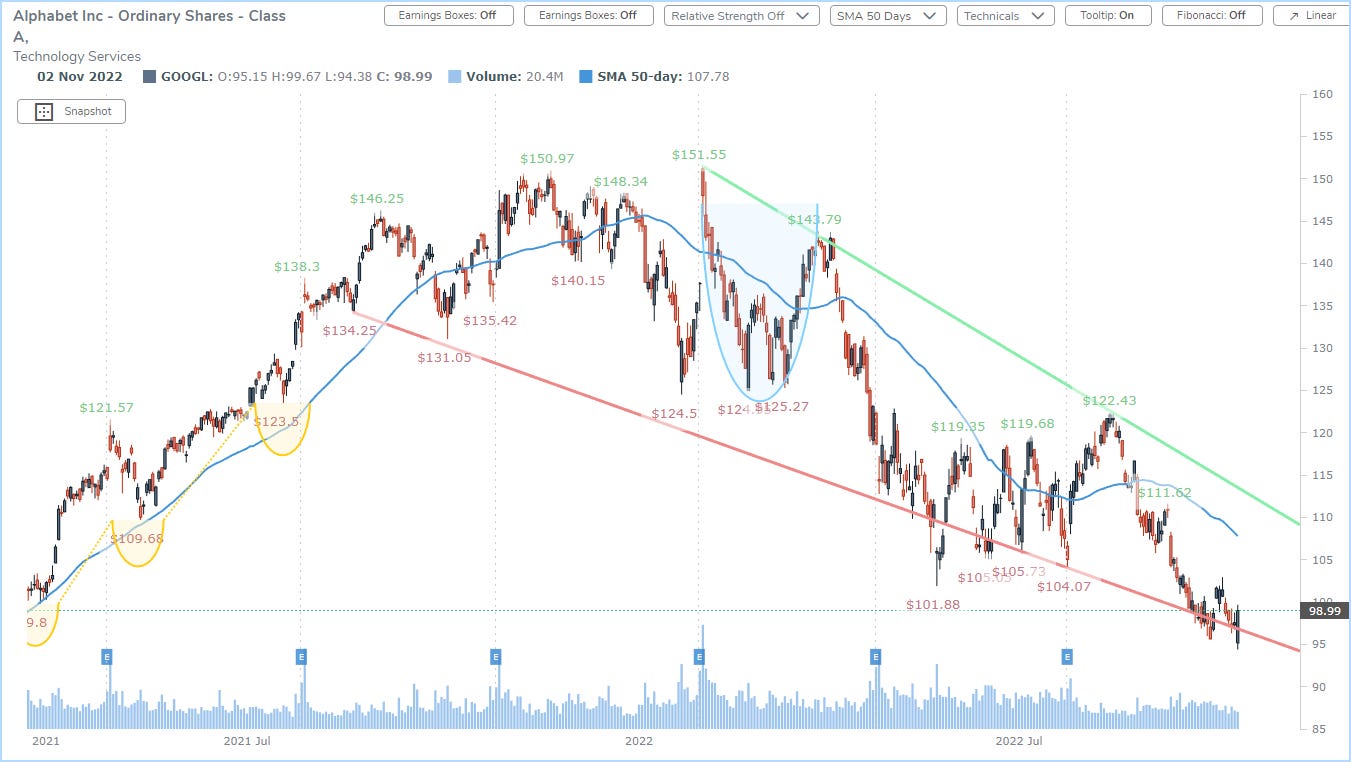
This is similar to AAPL; a bounce today off of trend support, but with a series of lower lows and lower highs, much like the SPX bounce, it’s hardly inspiring, yet.
The uniquely talented trader may find more here, but Pattern Finder just shows facts, and the facts are charts that are more hopeful for a bull run than definitive in these two mega techs.
(On a valuation level, we like GOOGL and the author is long GOOGL.)
Thanks for reading, friends.
What’s Next
We will continue to share charts, screens, and short discussions over the next few weeks before the CML Pattern Finder product becomes available in late October.
The product will have everything IBD MarketSmith® has, a lot more, like algorithmically drawn support and resistance trend lines, built with better, faster, more flexible, and more responsive technology.
It allows for additional technical signals beyond just those offered by the CANSLIM methodology, far richer fundamental screening data, but…
… it will cost 70% less. Yes, 70% less.
Stay tuned to this channel.
Thanks for reading CML Pattern Finder.