


The Nine Strongest Oil Stocks - Screening and Charting

Lede
Today we will focus on oil related stocks by looking inside specific industries, then screening for strong fundamentals on the one-side, and then strong one-year RS (relative strength) on the other.
First, Screen to Identify Population - The Chosen 9
The basket of stocks we will analyze starts from a screen I built in Pattern Finder:
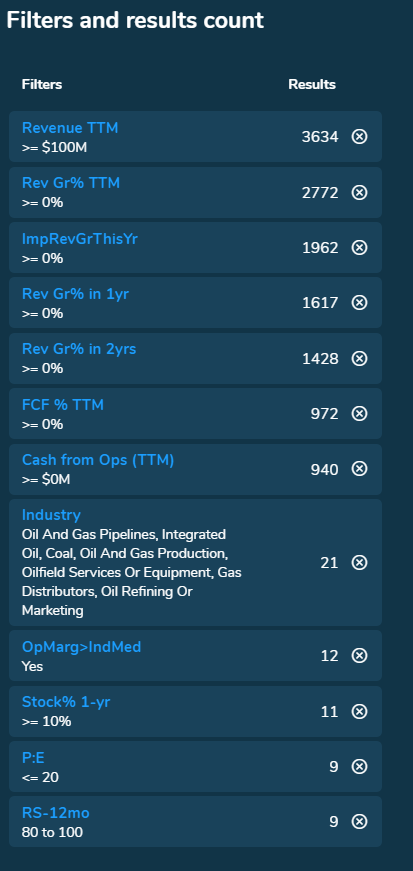
We looked inside the following seven industries:
• Oil And Gas Pipelines
• Integrated Oil
• Coal
• Oil And Gas Production
• Oilfield Services Or Equipment
• Gas Distributors
• Oil Refining Or Marketing
Then were refined the list down by some fundamental criteria (like FCF margin and revenue growth), a relative strength criterion (80 or greater out of 100 in the last year), stock return criterion (greater than 10% return in the last year), and finally valuation (a P/E below 20).
This took us down to nine companies.
(Pattern Finder members, feel free to recreate this screen to see the entire list.)
Charting
Once it turned to chart time, I categorized them into four buckets:
• Middle of channel
• Near support
• Rising off of recent support
• At Congestion
And here we go…
Middle of channel
Ticker MTDR sits in the middle of its trending support and resistance channel, both automatically drawn by Pattern Finder.

I drew in the potential profit and loss zones, with a stop at trend support and a limit at trend resistance (for example).
We can zoom into the channel:

Near support
Ticker CRK is near support.

I drew in (i) a horizontal line at the bottom of the cup (that cup is automatically drawn by Pattern Finder) and (ii) profit and loss zones from trend support to the bottom of the cup.
Here we zoom in:

Rising off of recent support
Two stocks jumped off the page here, and we will chart one of them; CHRD.
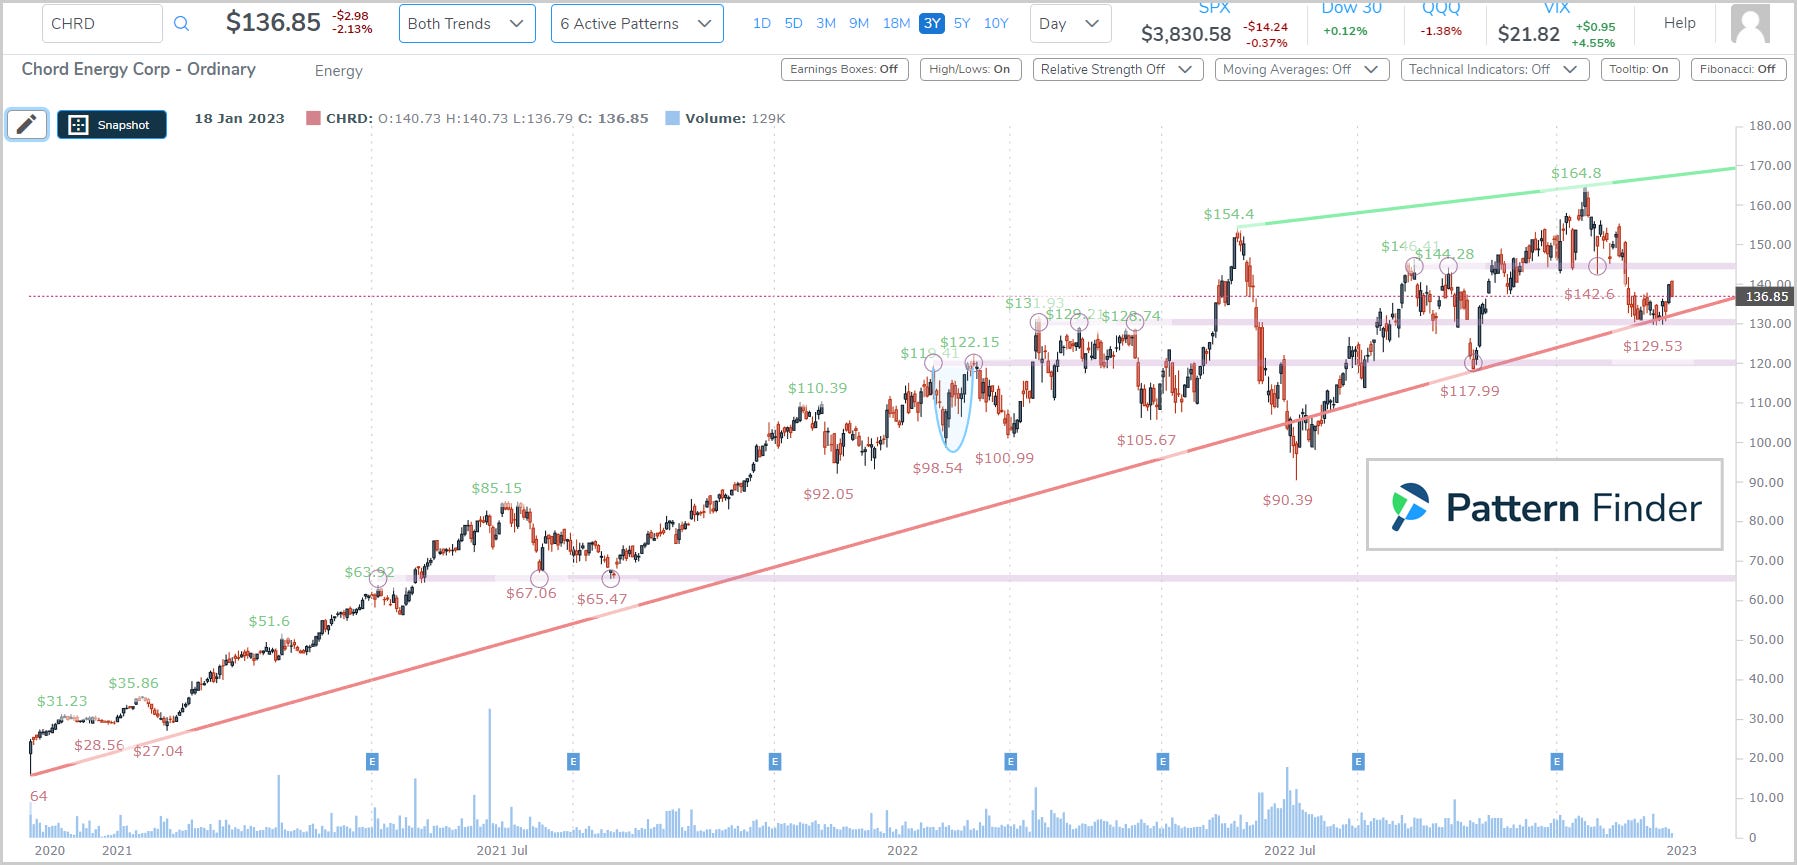
This has a rising trend support, a bounce off of that support and room to the nearest congestion (the pink line automatically drawn by Pattern Finder) and then higher to trend resistance.
We zoom in:

At Congestion
Finally we turn to those that are right at congestion and pluck one out; ticker ROCC.
Here is the three year chart:

The stock is right at that prior congestion point which acted as resistance several times in the recent past as well as an entire consolidation range just a few months ago.
We can zoom into this chart as well:

That’s it for today’s post! Nine stocks that fit very specific requirements and some charts showing various degrees of strength.
Conclusion
We truly hope you are enjoying using Pattern Finder and our posts and see how easy it is to improve your trading.
Get Pattern Finder in action, below, before the price hike in Jan 2023.
Thanks for reading, friends.