


Three Bullish Charts and When "Old School" Rules Matter

Preface
We called the coincidence of a bullish chart with bullish return characteristics and then with bullish sentiment a bullish entanglement.
We do so again today, but we follow the logic through three companies - all three with bullish charts, but all three with another characteristic that is a “back to basics” reminder of certain technical indicator signals.
Bullish Charts - Some Entangled
We start with the “Heavy Buying Volume:” screen under the “RS, Volume, and Technicals” section inside Pattern Finder for our first two stocks.
(Pattern Finder is our stock charting and screening platform with proprietary support, resistance, congestion, and target zone algorithms.)

We start with large cap software company ADBE (which has earnings after the bell so all analysis should be reviewed after the release.)
But, this time we add RSI to the chart at the bottom in an orange line.
RSI is the relative strength index, which has unfortunate naming as it is quite different than just relative strength.
The general thought process around RSI is that a number under 30 is oversold (though our research has shown that there is a stronger signal if RSI is below 25) and over 70 is considered overbought.
Hold that thought for a sec. Here is the 3-year chart:

ADBE has ripped higher, bouncing right off of our trend support line (red line), and then through two congestion lines (pink lines).
Before we address RSI, let’s follow through on our plan.
Next we turn to the return distribution characteristics: skew (asymmetry of returns) and kurtosis (tail behavior).
We ask our AI, that will soon be inside Pattern Finder and TradeMachine, to compare ADBE to the market and we share just the parts of the summary we want to focus on today.
(TradeMachine is our award winning option backtesting platform.)
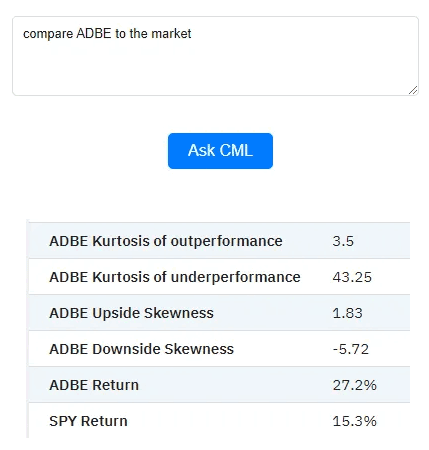
Even though ADBE has outperformed the market over the last year 27.2% versus 15.3%, the skew leans left (downside) and the tail are larger on the downside than the upside.
Those two return dynamics, skew and kurtosis, generally hurt option returns when selling a slightly out of the money put spread, and they did in the case of ADBE:

While the win rate is good at 65%, a 12.7% total return versus a stock that itself was up 27% over the same time period is a reflection of that downward leaning skew and kurtosis.
We can turn back to RSI now, which is at 77, and we find a company that is overbought on one indicator, and has shown more downside tail risk and asymmetry of returns than upside which has affected option trade returns.
At the risk of being embarrassed by a raging bull market in tech stocks and in particular one of the large cap leaders, this feels like an overbought stock and less than optimal return characteristics.
For completeness, we ask our AI for the sentiment surrounding ADBE:

The news sentiment rating for ADBE is 70, which is somewhat bullish.
The headlines suggest that Adobe is making significant advancements in generative AI capabilities
… <snip>…
Additionally, the launch of Adobe Express with Firefly could revolutionize how creators and brands design and share standout content.
Overall, the news headlines suggest that Adobe is making strategic moves to stay ahead of the competition and continue to innovate in the AI space.
Final Sentiment Score Adjustments
<snip><snip>
<snip>
…
- The final sentiment score I computed was 85 with a 15 point adjustment beyond news.
So, we see a strong stock chart with strong sentiment, but the poor skew and kurtosis behavior over the last year and an extended RSI leave us looking for another opportunity.
We turn to ticker BSY from the same screen in Pattern Finder.
Here is the 3-year chart, with RSI in orange below it:

Again, like ADBE, this is a very strong looking chart, with the stock bouncing right off of the algorithmic support Pattern Finder created, but…
… RSI is at 76. That’s overbought per the general technical rule.
In this case, though, the distribution dynamics have been quite favorable for a long position.
We ask our AI to work for us:


Upside kurtosis (tail behavior) is much larger than the downside, and the upside skewness is larger than the absolute value of the downside skewness.
We should see better option returns for the short put spread we test due to those skew and kurtosis dynamics, and we do:

BSY stock was up 65% over the last year and a relatively straightforward “not bearish” option strategy returned 84% with a 76.5% win rate.
Skew and kurtosis for the win again.
Let’s check on sentiment per our AI. The short version yields this:
The final sentiment score I computed was 65 with a 15 point adjustment beyond news.
We aren’t in love with either set-up, as both of the first two stocks we looked at are overbought per RSI, but… BSY does have better distribution characteristics.
Our final stock we get from the “Directional Charts” section of the Pattern Finder screener under the “Bullish Charts; 3-yr Charts; Nearest Congestion or Trend” screen.
We get ticker TDC and share the 3-year chart with RSI potted along the bottom.

This stock too has ripped higher, this time right off of a cup. The next upside target would be that all-time high about 14% higher. RSI is 74, which too is overbought.
We ask our AI to do the distribution analysis and see that we have the right lean: larger upside tails than downside tails, and a return distribution that is asymmetric to the upside.

We ask our AI to do sentiment analysis and the short version is this:
The final sentiment score I computed was 80 with a 15 point adjustment beyond news.
In total, we see yet another stock like BSY - it’s overbought per RSI, but has had favorable distribution of return characteristics.
All three of these have good looking charts, but all three come off as overbought, and we didn’t need a fancy measure. Old reliable RSI was good enough for us.
They key in a market where certain sectors have been realizing large gains in a short period is not only to follow a plan:
Bullish chart
Bullish return characteristics
Bullish sentiment
Lean on the “old school” rules. RSI is one of our favorite measures to lean on in such a market, and today we see why.
If you’re starting to get the sense that stock and option trading isn’t quite as easy as people on Twitter would have you think, then you’re on the right track and that’s why everyone isn’t a billionaire.
If you’re starting to get the sense that there are plans to be made which are methodological, then you’re even further on the right track, because you’re seeing the truth and you’re realizing the commitment needed.
And if you’re starting to get the sense that there is a platform to help - then you’re riding with us: Recognize that it’s not easy. Plan it. Leverage technology to do it.
That’s our way and we hope yours as well.
Conclusion
Kurtosis and Skew for backtesting are coming to TradeMachine in 14 days when we hold our webinar.
Kurtosis and Skew for screening in Pattern Finder are coming in 14 days (when we hold our webinar).
Sentiment analysis will be inside both products as well (when we hold our webinar).
The price for the products will rise when the new capabilities are available but it will not go up for grandfathered in members.
So, if you’re interested, you can learn about either or both products here:
Pattern Finder - Stock charting and screening platform with proprietary support, resistance, congestion, and target zone algorithms. If you’re not an options trader, this is for you.
TradeMachine - Stock and option backtesting platform. If you’re an options trader, this is for you.
We note that TradeMachine members gain access to Pattern Finder for just $11 / mo.
Thanks for reading, friends.
Legal
The information contained on this site is provided for general informational purposes, as a convenience to the readers. The materials are not a substitute for obtaining professional advice from a qualified person, firm or corporation. Consult the appropriate professional advisor for more complete and current information. Capital Market Laboratories (“The Company”) does not engage in rendering any legal or professional services by placing these general informational materials on this website.
The Company specifically disclaims any liability, whether based in contract, tort, strict liability or otherwise, for any direct, indirect, incidental, consequential, or special damages arising out of or in any way connected with access to or use of the site, even if I have been advised of the possibility of such damages, including liability in connection with mistakes or omissions in, or delays in transmission of, information to or from the user, interruptions in telecommunications connections to the site or viruses.
The Company makes no representations or warranties about the accuracy or completeness of the information contained on this website. Any links provided to other server sites are offered as a matter of convenience and in no way are meant to imply that The Company endorses, sponsors, promotes or is affiliated with the owners of or participants in those sites, or endorse any information contained on those sites, unless expressly stated.