


Today's Exploding Volume and Movers

Lede
With Pattern Finder’s official release now due in less than a week, we finally turn to screens for real-time exploding volume.
We look at two screen — one with rising stocks and one with dropping, and investigate four charts (two of each).
The next post you will receive in your inbox will be the announcement of Pattern Finder’s general availability and the discounted rate will be available for one-week after that announcement.
Exploding Volume - Upside Moves
Today we make use of Pattern Finder’s real-time volume data and screening capability. First we look for exploding volume to the upside:

Specifically we screen for companies that have at least 1 million shares traded today, but Pattern Finder uses a real-time linear extrapolation — so stocks on the path to at least 1 million shares traded.
With that same measure, we screened for stocks with 4x the implied volume today than the 30-day average volume, a stock price above $10, revenue of at least $50 million, and an intraday stock move of at least +1%.
This took us to 10 companies, and we plucked three out.
LRCX - Lam Research
Here is the 18-month chart with the automatically drawn trend support (red line), resistance (green line), and congestion lines (pink lines).
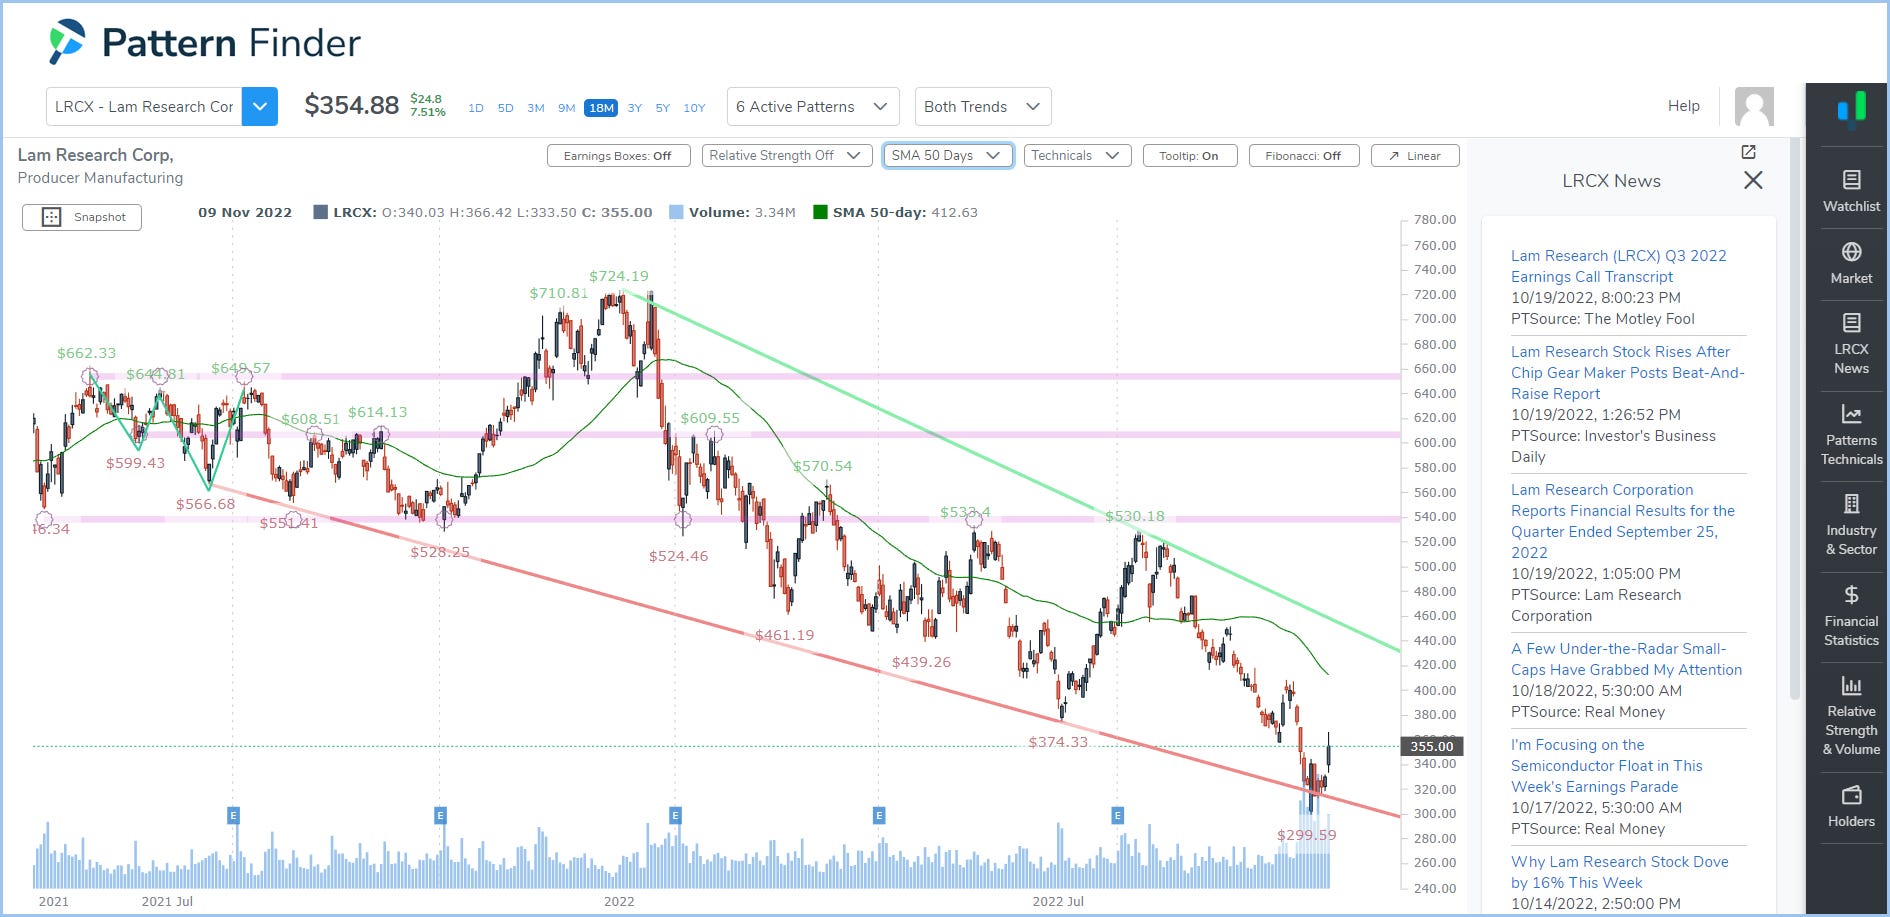
We also keep the company news tab opened in this screenshot; we can see the stock is moving due to earnings and we have included the 50-day SMA (dark green line).
LRCX was right on trend support and bounced hard off it on the earnings release. It has risen on heavy volume, and if the rally can be held, it has quite a bit of room to the 50-day SMA and even trend resistance.

MCRI - Monarch Casino & Resort
Another earnings mover on heavy volume is MCRI. Here is the 3-year chart, with all the same settings and we add the 200-day SMA:
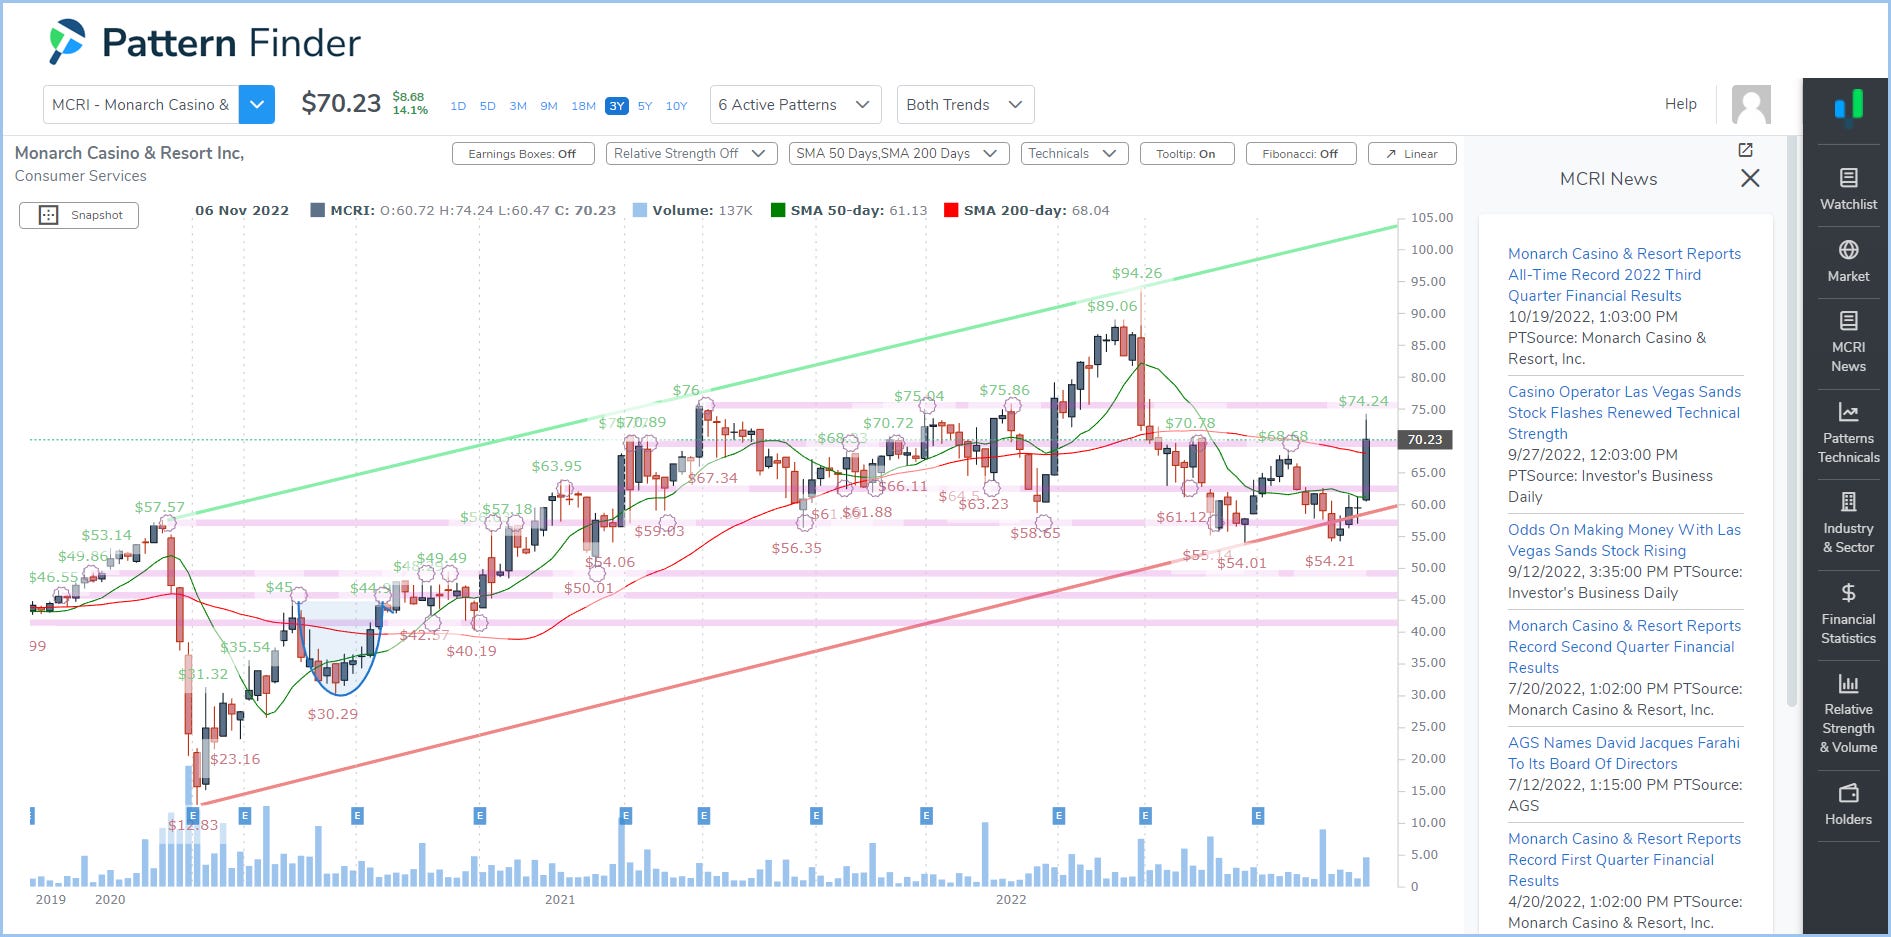
MCRI bounced of of support, is now through the 50-day SMA and right on the 200-day SMA.
When we look to the 5-year chart, wee can see how much room there is for this to catch a bid… if it catches a bid.

We’ll also point out that the IBM chart looks interesting as well, but will move forward in this post.
Exploding Volume - Downside Moves
We then turned to the same screen, but with a downside move on the day, and out of about 9,000 stocks, the screener returned just five.
ALL - Allstate Corp
We plucked ticker ALL from the screen, and here is an 18-month chart:
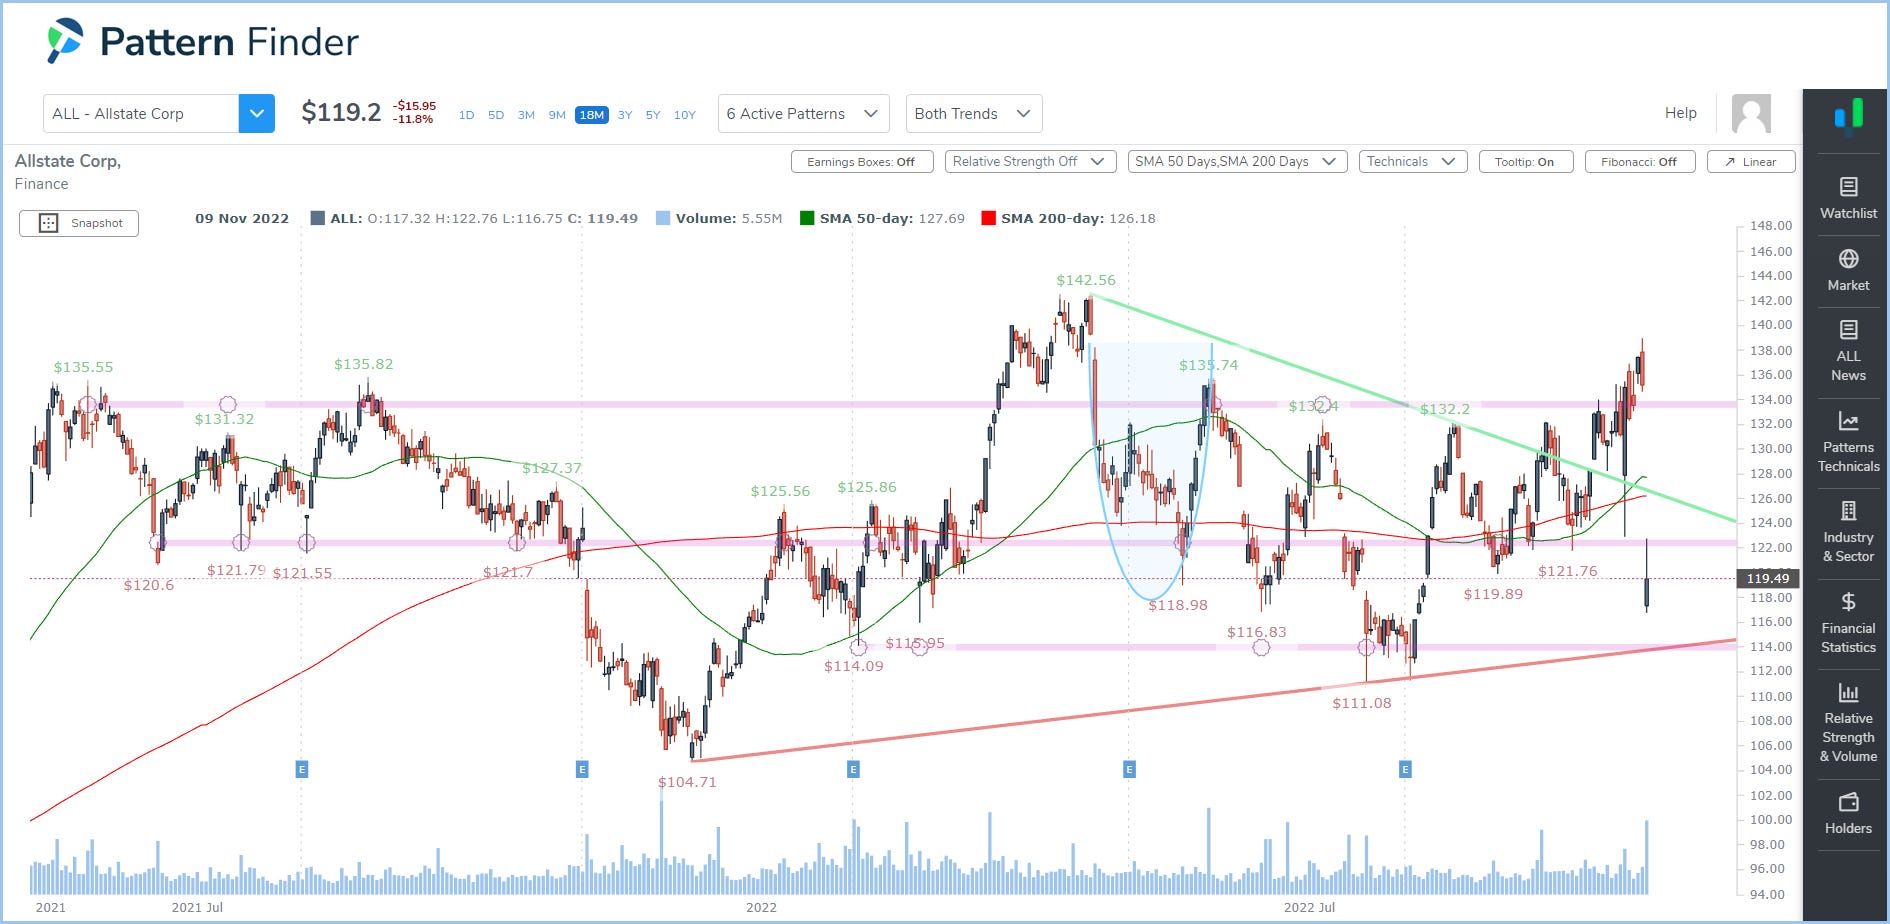
This is a brutal chart, with the stock down more than 10% on the day, through the 50-day and 200-day SMAs (simple moving averages).
Interestingly, Pattern Finder already had ALL well above trend resistance, so the stock was coiled one way or the other - either looking to reset resistance levels higher on a newly defined up trend, or… not.

Trend support looks like the next logical downside target.
WSO - Watsco Inc
We then turned to WSO, a ‘Producer Manufacturing’ company according top its industry classification in Pattern Finder. Here is the 18-month chart:
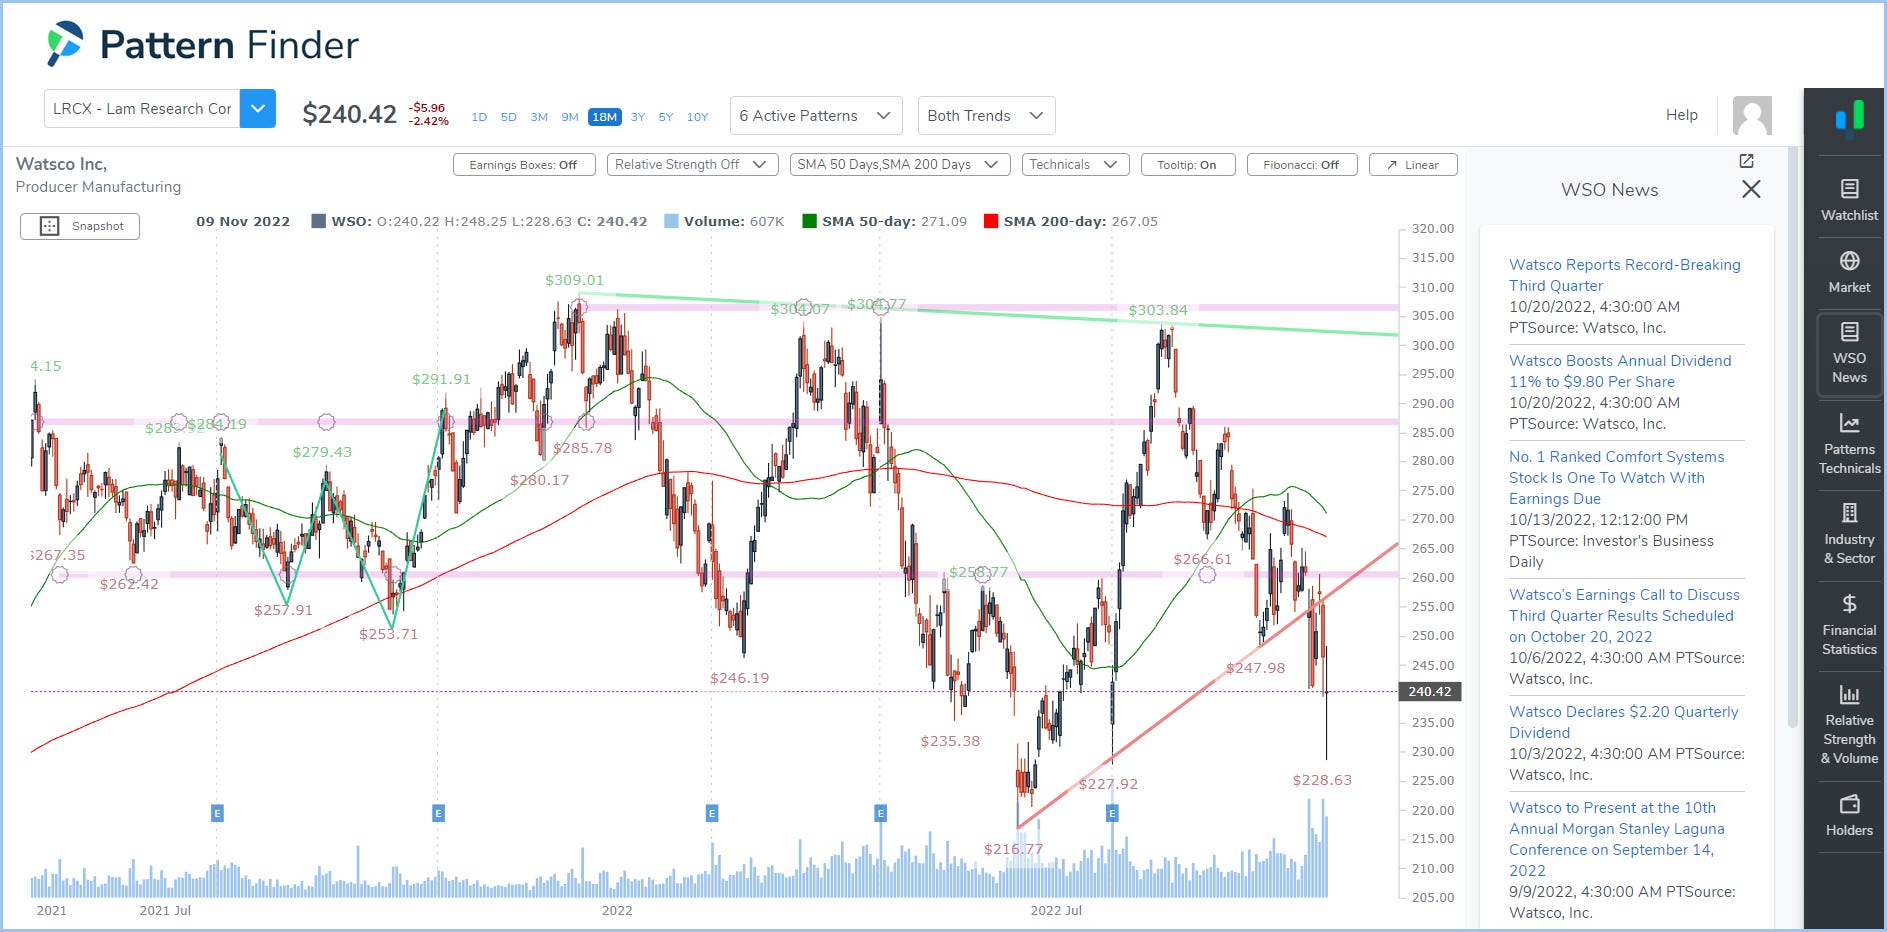
The open news tab shows us that this too is an earnings related move.
Interestingly, even the day before this move, WSO was already through trend support (red line) and had recently fallen below its 50- and 200-day SMAs.
We have to turn to a 5-year chart to get more context for this move.

A failure below the trend support could lead to the congestion point line (pink line) and after that, if there is an “after that,” … it’s not good.

Conclusion
Alright, we are now done with our final post before Pattern Finder is released!
The posts will keep coming, but this time, the platform will be available to you for actual use. And, finally, we share two videos for you!
First, a 5 minute video of Pattern Finder’s charting (using Tesla):
And another 5 minute video on screening:
What’s Next
We will continue to share charts, screens, and short discussions over the next few weeks before the CML Pattern Finder product becomes available in late October.
It’s less than a week away!
The product will have everything IBD MarketSmith® has, a lot more, like algorithmically drawn support and resistance trend lines, built with better, faster, more flexible, and more responsive technology.
It allows for additional technical signals beyond just those offered by the CANSLIM methodology, far richer fundamental screening data, but…
… it will cost 70% less. Yes, 70% less.
Stay tuned to this channel.
Thanks for reading CML Pattern Finder.
Great Presentation Ophir! Looking forward to all of the advanced tools that I have only begun to dig into.