


Two Breakouts, MDB, Heavy Bullish and Bearish Volume With Stock Moves


Lede
Today we will look at a recent breakout with follow through, a breakout today that may follow through, tech darling MDB’s spike off of earnings, then a list of bullish and bearish heavy volume screen results.
Prior Breakout Confirmed
We start with a resistance breakthrough that we posted on Twitter yesterday for Signet Jewelers (NYSE:SIG).


We found it with the Pattern Breakouts Tab:

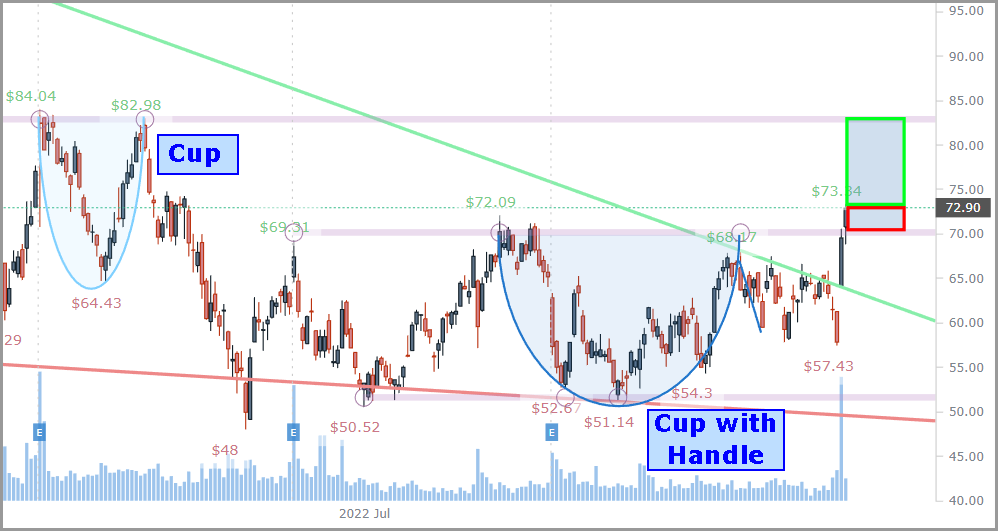
And now we can update the chart we posted on Twitter, with the move today:

Note the cup that formed back earlier in 2022 and the more recent cup with handle. (These are automatically drawn by Pattern Finder).
This creates a nice set-up where the loss zone would be down to the top of the cup with handle that just formed, and the profit zone could be stretched to the top of the cup that formed earlier in the year.
In this case we have an agreement from Pattern Finder - the automatically drawn trend resistance line (the green line) crosses through the right hand side of the recent cup with handle (also automatically drawn), and for the bullish trader, creates a sound trading plan with an exit plan for a win and loss.
Here we zoom in for clarity:
Since we’re on this subject and pattern type, we can look for another stock making a similar breakthrough trend resistance that we pluck off of the ‘Pattern Breakouts’ tab:

And we can then look to the 3-year chart for Ferguson Plc. (NYSE:FERG):

We see another breakthrough trend resistance that Pattern Finder identified right after a cup with handle, like SIG.
Here we zoom in:

A loss zone can be drawn to the nearest congestion line which again is near the top of the cup, and the profit zone would be to the congestion line above, formed by six prior reversals at that stock price.
Here is a zoomed in picture of the past at that $130 (ish) level)

That $130 level is a convincing exit point for a swing trade.
In the News
We noticed that tech darling MongoDB Inc (NASDAQ:MDB) is having a large rise off of an earnings report, so we took a look. Here is the 3-year chart:

This is a cool chart, with three ascending bases in recent history - MDB does have this history of short-term booms with three higher highs and then a rise.
Today’s price is conveniently right at the price of the lowest base in the first ascending base pattern.
The bullish trader could speculate on a rally, but the more cautious trader could see the price barrier today as a confirmation that the stock may have exhausted all of its post-earnings move, and may even have downside. Of course, the PPI and CPI reports to come will have a lot to do with that.
Screen Results
Finally we share some ticker lists for you to peruse.
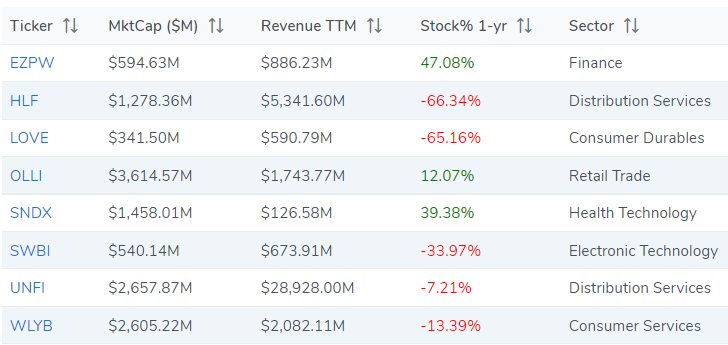
First, the ‘Bullish Heavy Volume on the Day’ screen:

Just six stocks qualify for this heavy directional volume screen, and here they are:

And then we share the ‘Bearish Heavy Volume on the Day’ screen:

Eight stocks qualify here for the heavy bearish directional volume screen:
Have at it!
Conclusion
We truly hope you are enjoying using Pattern Finder and our posts and see how easy it is to improve your trading.
Become a member of Pattern Finder, if you so choose, at the link:
Thanks for reading, friends.
Hello, What "PatternBreakout" filters did you use to find SIG and FERG? Thanks, Matt