


Two Bullish Charts: How Option Trades Can Profit Irrespective of Stock Returns

Preface
Today we continue on our path to find bullish charts on the one-hand, but also an historically ideal distribution of returns as measured by tail risk (kurtosis) and distribution skew (a measure of the asymmetry of return distributions).
Definitions
We start with some definitions so we can move quickly forward to actual trading and in this case we add one new term: skewness (not to be confused with option skew).
Tail Risk: The risk of an extreme event occurring that could drastically change the value of a portfolio or investment. It's called "tail risk" because this kind of event is often at the tail ends (the far left or far right) of a probability distribution, indicating that these events are unlikely but not impossible.
Kurtosis: A statistical measure that essentially measures the "tailedness" of the probability distribution of a real-valued random variable.
Tail analysis is backward looking.
Skew: In the context of stock performance, skewness or skew refers to the measure of the asymmetry of the probability distribution of a real-valued random variable about its mean.
There are two types of skewness - positive skewness and negative skewness.
Positive skewness, often referred to as right-skewness, occurs when the right tail (larger values) of the distribution is longer or fatter than the left. In the context of a stock's returns, this means that the stock has relatively frequent large gains.
Negative skewness, often referred to as left-skewness, occurs when the left tail (smaller values) of the distribution is longer or fatter than the right. In the context of a stock's returns, this means that the stock has relatively frequent large losses.
Skew is also a backward looking analysis.
Together, kurtosis and skew give us an view of a stock’s return distribution characteristics, especially when we compare the returns of a stock to the market (S&P 500).
Bullish Directional Charts With Positive Tail and Distribution Characteristics
We start with the directional screens from Pattern Finder and we pluck out ticker GWRE.
We let Pattern Finder draw in the congestion lines (pink), trend support (red line), trend resistance (green line), and crucially, the next target zones for the upside and downside.
This screen should deliver a list of companies with favorable target zone ratios (distance to upside is larger than distance to downside).
Here is the 3-year chart for GWRE.
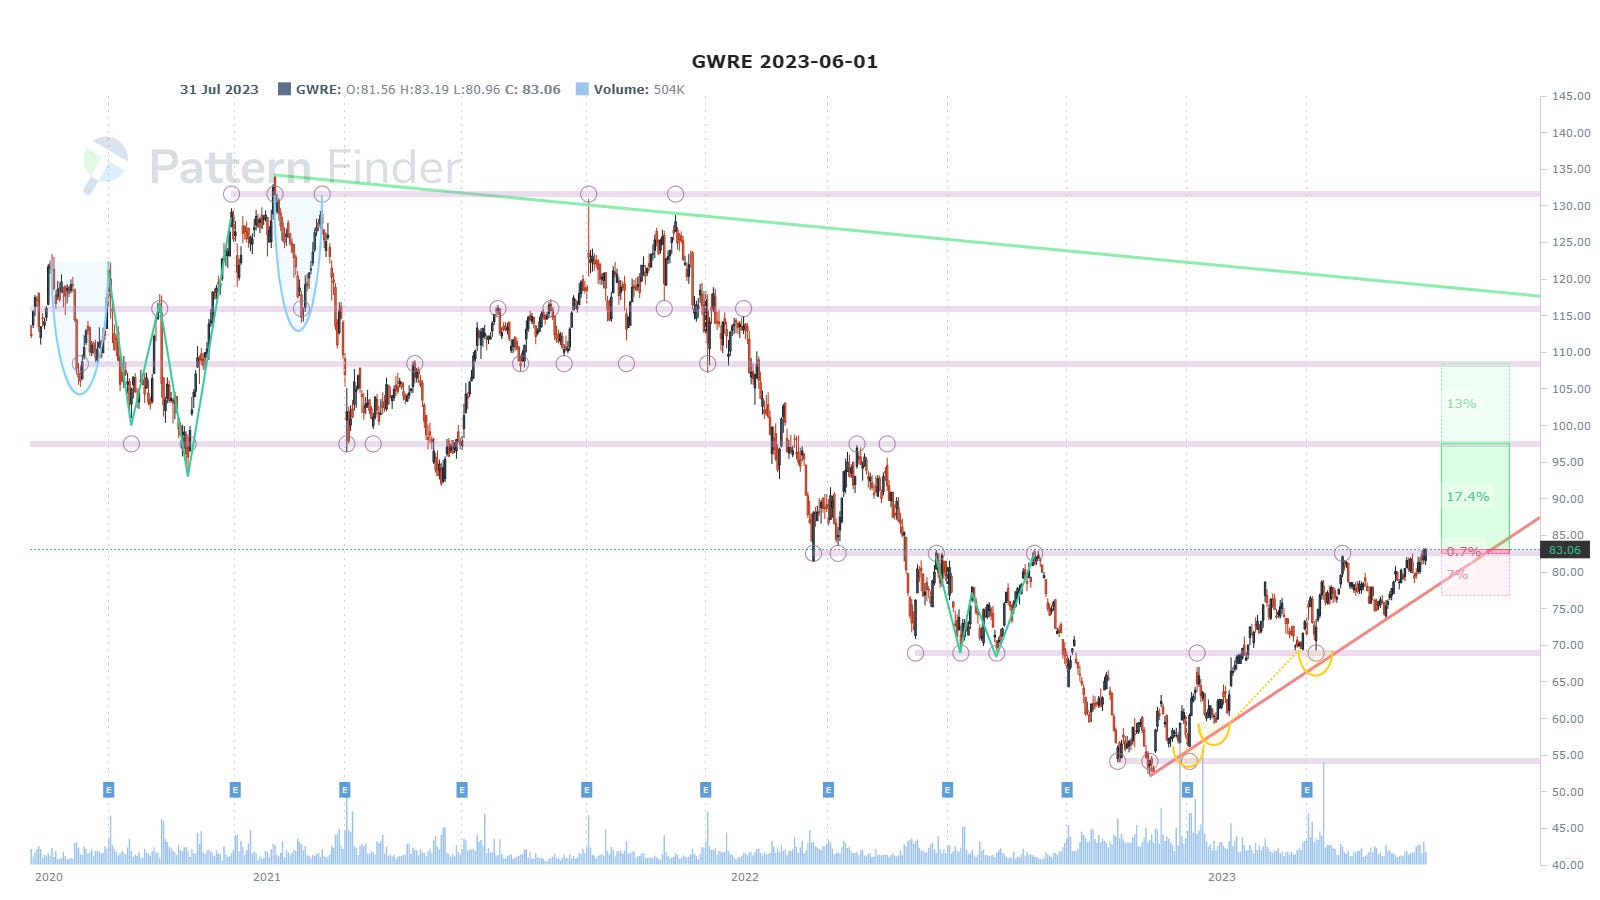
The stock has walked up support and has that favorable zone difference.
We note that GWRE has earnings in about an hour, so this set-up will have to be reassessed after the print - this is not about an earnings speculation at all.
We then compare GWRE to the market, using our newly released free integration with ChatGPT but with real time financial, price, fundamental, technical, and economic data layered with our own statistical models.

Here are the results for the last year, and focus on four numbers:
The comparison of “kurtosis outperformance” to “kurtosis underperformance” and the same but for “upside skewness” and “downside skewness.”
We want the upside to be larger than the downsides, and we see that in GWRE:

We note that the stock has hardly been a barn burner for returns, up just 3.8% in 12-months; that’s not the analysis - we want to look at the characteristics of the daily return distribution versus the market.
Here we also share the plot that is generated by our tool; these are daily return comparisons to the market, where green bars are outperformance on the day and red bars are underperformance.
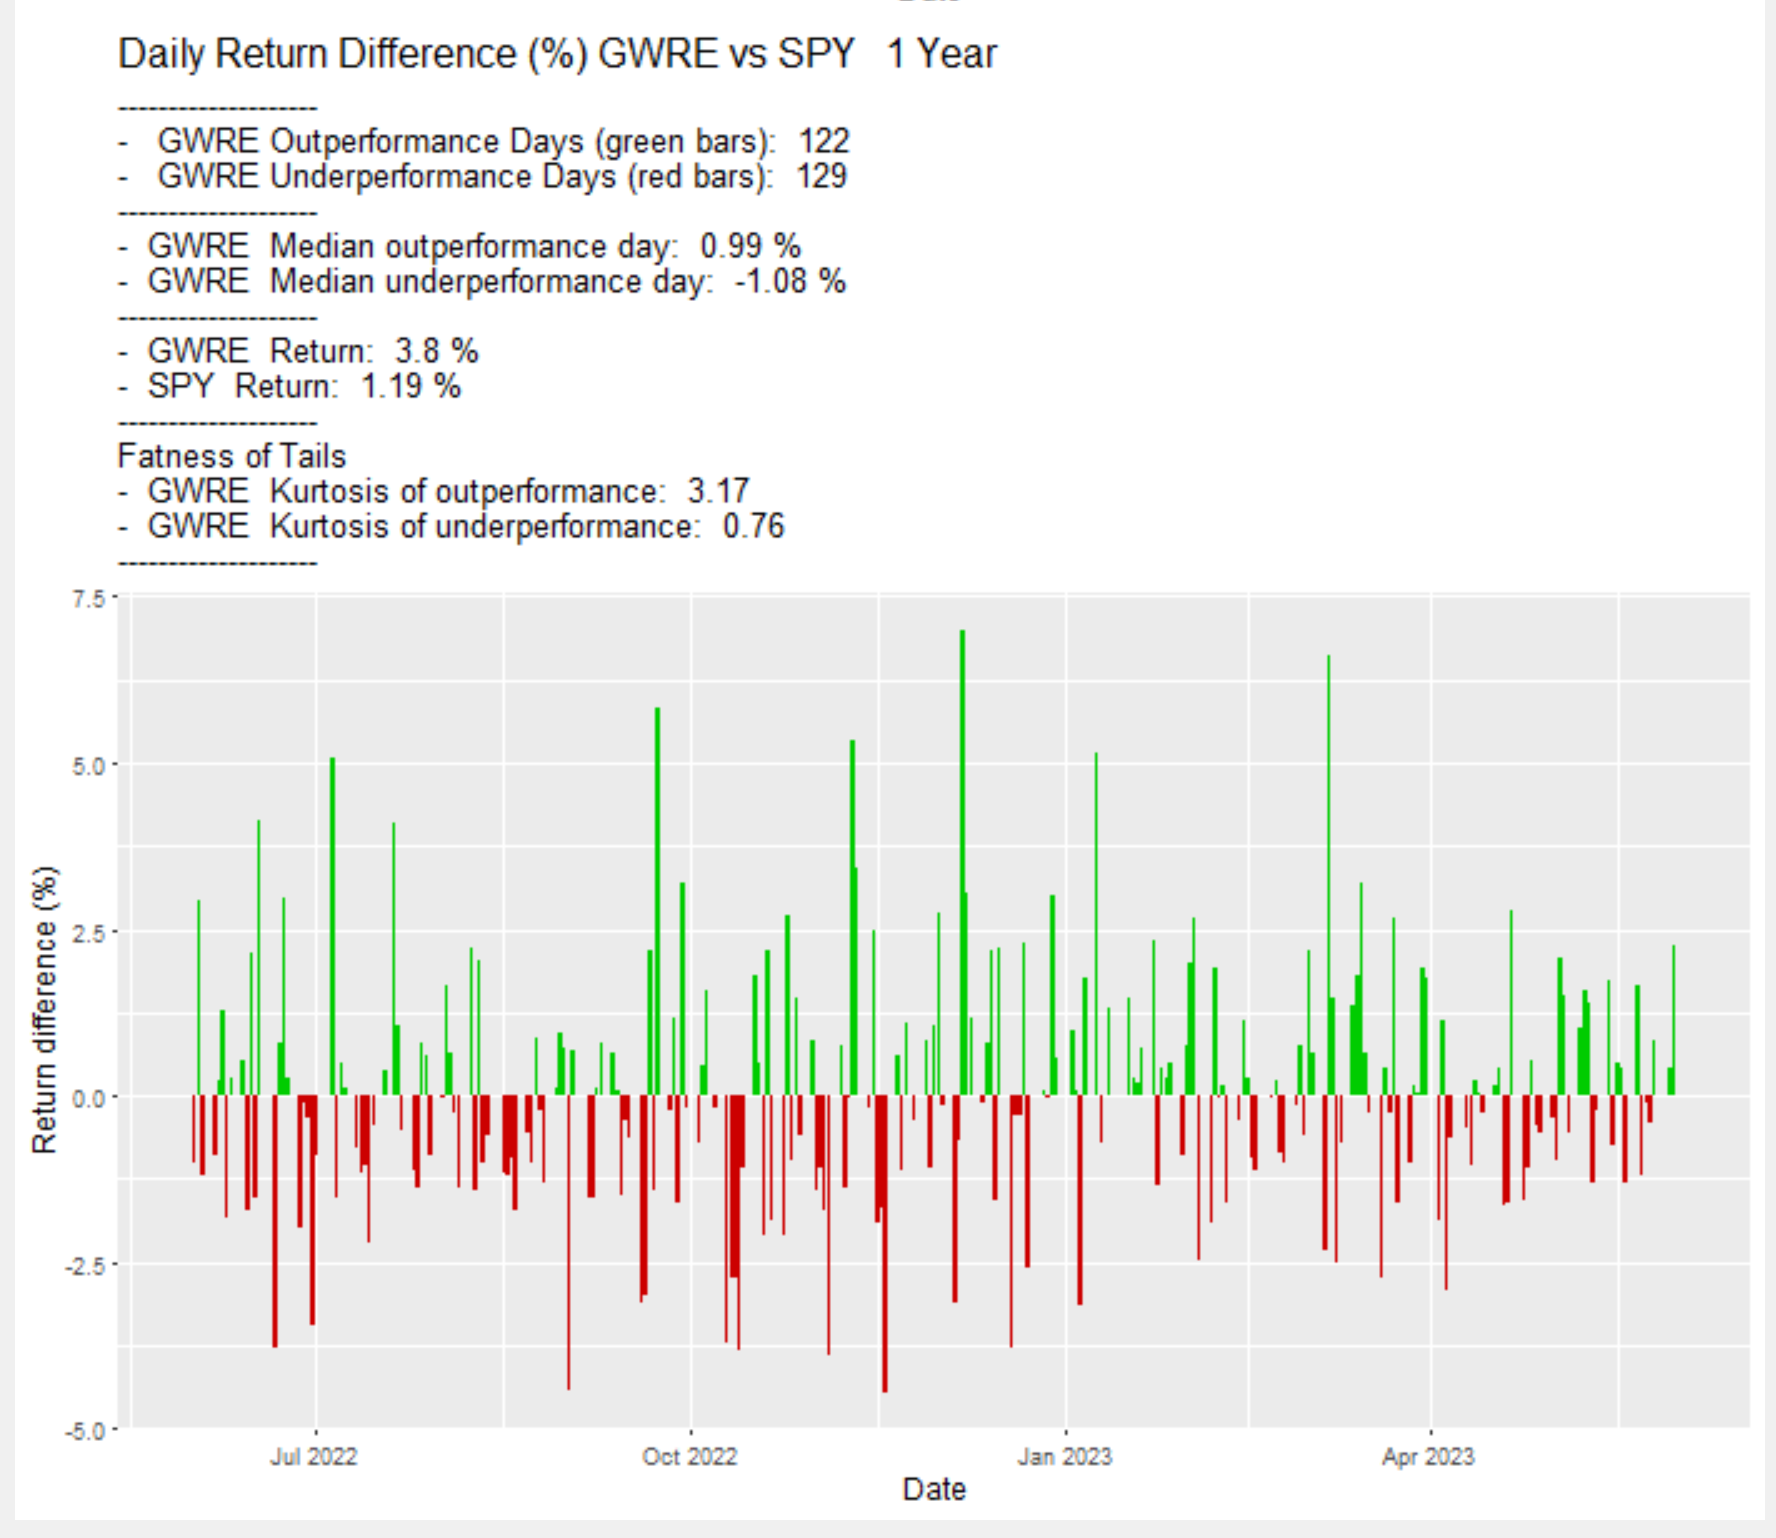
That skew and kurtosis (tail behavior) is actually fairly evident just by looking at the daily return comp.
If all of this is true, then even though GWRE had less than stellar stock returns at +3.8% over the last year, selling a weekly out of the money put spread (and always avoiding earnings) should take advantage of the option market’s pricing.
That is, while the option market generally prices down side volatility higher than upside volatility, that would b a “mispricing” for GWRE over the last year since it was the upside moves that proved (historically) to be more volatile.
Here is one-year backtest from TradeMachine doing just that and we see a 75% win rate and a 30%+ return versus the stocks +3.8%.

We can also do a 6-month backtest and see those results:

Alright, we note again that this backtest intentionally avoids earnings, so the event today is a clear “stop sign” for this backtest.
Next we do the same thing but with ticker DDOG from the “Bullish Charts; 18-mo Charts; Nearest Congestion or Trend” screen in Pattern Finder, also under the “Directional Charts” screen category.
We see a different set-up here, where DDOG is essentially stuck

A stuck stock price can actually be quite a nice find for an option trader, as long as the volatility characteristics appear to be favorable (it’s probabilities, not a sure thing - not a magic bullet).
We then ask the same question for DDOG:

And here are the one-year results; focus on the same measures - kurtosis and skewness with upside compared to downside:

Yet again, we see a stock with a pretty meager one-year return, down 0.5% over the last year versus the S&P 500 up 1.2%.
So, this doesn’t obviously scream a good trade candidate unless we go further - as we are with tail and skew analysis.
Here is the distribution chart delivered by the tools:

Yet again, even an eyeball test shows that the green bars have larger “big bars” and they occur more frequently.
So, we take this stock down 0.5% on the year and run the same backtest in TradeMachine.
Here is the one-year backtest: a 70.6% win rate and a 176% return.
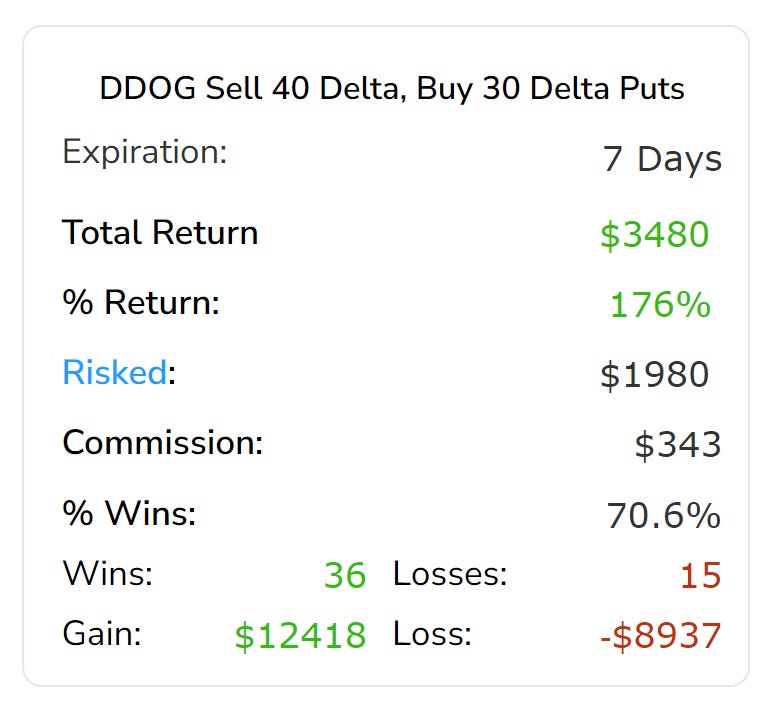
And here is the six-month backtest: a76% win rate and 197% return.

Alright, that’s it for today’s quick post.
This is not a trade recommendation at all.
We are demonstrating how important tail and skew characteristics can be when trading stock and options (and few people use them).
In a former post, we actually showed how MSFT, which has crushed the market over the last year and 3.5-years, actually showed negative returns for a simple short put spread while AAPL, a stock with nearly the same return, showed large positive returns in the option backtest.
The explanation was, you guessed it, tail characteristics.
Conclusion
We hope this was instructive and thank you for reading.
We just released our integration of real-time financial and statistical data into ChatGPT. We may or may not leave that free but it always be available to any of our paid products with unlimited usage.
But, a scannable and more advanced version of this analysis, and a lot more, is coming to our three products in the next several weeks (not quite, yet!).
CML Pro is a stock and economic research platform. We’ll put a pin in that product for this post since it is not charting or option related.
TradeMachine is our option backtester. It’s been available since 2015 and tens of thousands of option traders have used it as their secret weapon.
Pattern Finder is our newest product - it is an advanced stock chart platform with our algorithms drawn on top, along with a remarkably robust screener and fundamental analysis data.
The products are going to improve - slowly, and then all at once.
The prices are going to go up too.
But the price for members that join before we integrate our vast libraries of AI over the coming weeks, months, and years, that are in development, like this tail analysis report turned into scannable data, will not go up.
You can learn more about each product in the links below.
Learn about Pattern Finder here.
Learn about TradeMachine here.
Thanks for reading, friends.
The information contained on this site is provided for general informational purposes, as a convenience to the readers. The materials are not a substitute for obtaining professional advice from a qualified person, firm or corporation. Consult the appropriate professional advisor for more complete and current information. Capital Market Laboratories (“The Company”) does not engage in rendering any legal or professional services by placing these general informational materials on this website.
The Company specifically disclaims any liability, whether based in contract, tort, strict liability or otherwise, for any direct, indirect, incidental, consequential, or special damages arising out of or in any way connected with access to or use of the site, even if I have been advised of the possibility of such damages, including liability in connection with mistakes or omissions in, or delays in transmission of, information to or from the user, interruptions in telecommunications connections to the site or viruses.
The Company makes no representations or warranties about the accuracy or completeness of the information contained on this website. Any links provided to other server sites are offered as a matter of convenience and in no way are meant to imply that The Company endorses, sponsors, promotes or is affiliated with the owners of or participants in those sites, or endorse any information contained on those sites, unless expressly stated.