


Understanding SPY Support on Inflation Data; Identifying Profitable Companies with Rising Stocks


Today we’ll start with the broader market, using the SPY ETF, our proxy for the S&P 500 index, and then move to a new screen to identify stock strength, even in this tape.
S&P 500 (SPY)
The inflation data reading came in worse than expected yesterday morning and immediately took the SPY back to support with accelerating selling into the close making that support look ever so shaky.
Here is our first image:

Pattern Finder found us the resistance trend (the green line), which hits all three recent lower highs and exactly on the 200-day simple moving average (SMA).
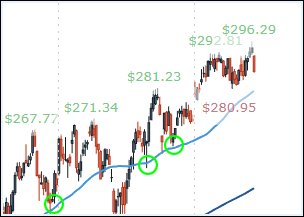
Here is a zoom on in the top of the range:

But the top of ranges isn’t the concern now, it’s the bottom. So, we’ll look at the most urgent support, at which the market closed (imagine that).

But we also see that the SPY crossed below the 50-day SMA, meaning the S&P 500 is in technical failure (below both the 200- and 50-day SMA).
The swing trader that was long into the CPI print likely stopped out yesterday at support, minimizing losses. But, contrarians often use support as an entry level, and that means we need the next logical support if the $390 level is broken.
Here is Pattern Finder’s next logical support drawn on the chart:

The algorithm passes through the low of the beginning of an ascending base (a CANSLIM bullish pattern) that began back in March 2020’s COVID lows. It passes through the series of recent lows, and gives us a $378 next support.
With the index in technical failure, we would have to look at the 52 week low or even the Fibonacci extensions to get the next support.
Here is the pivot point chart from Pattern Finder which shows both in a scatter plot format for quicker access.
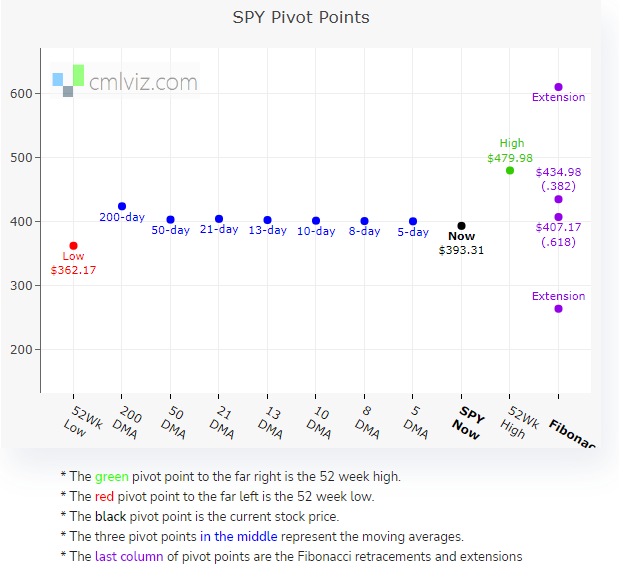
The 52 week low is down at $362 and the Fib extension is below that.
New Screen for Price Strength
This will act as our third demonstration of creating a custom screen, but this time we will not use volume, and rather focus on price.
We screened for stocks that met the following criteria:
Stock price is up over the last week.
Stock price is up over the last 4-weeks.
Stock price is within 1% of the 52 week high.
Market cap is greater than $500 million.
Revenue in the trailing twelve months is larger than $100 million.
Then we added some financial stability metrics, our first demonstration of that capability.
Operating margin is positive.
Free Cash Flow (FCF) is positive'.
You can see the screen and the waterfall of results as each criterion is added to the screen:

We were left with stocks performing well that are turning profits and producing FCF.
We plucked Cigna Corp (CI) out of the list; the $90 billion market cap health insurer.
Here is a chart of Cigna (CI):

This time we didn’t even need to turn on the trend finder algorithm, we just used the 50- and 200-day SMAs.
CI formed an ascending base (a bullish CANSLIM pattern) in early 2022 which was mimicked by the 50-day SMA.
Here is a zoomed in image of that ascending base, signified by the three rising yellow bases, and the 50-day SMA signified by the blue line.

With the 50-day SMA acting as a reasonable rising support, we now zoom into the current price action:
CI may well be on its way to testing that 50-day SMA again, and if so, it could act as a trigger, and then the trend support algorithm could be used as the stop and the trend resistance as the profit zone.
But… in reality, after news like Tuesday’s and the S&P 500 in technical failure, a trader might instead consider short opportunities rather than new longs. We will demonstrate that capability of Pattern Finder soon.
What’s Next
We will continue to share charts and screens with short discussions over the next few weeks before the CML Pattern Finder product becomes available.
The product will have everything IBD MarketSmith® has, a lot more, like algorithmically drawn support and resistance trend lines, built with better, faster, more flexible, and more responsive technology.
It allows for additional technical signals beyond just those offered by the CANSLIM methodology, far richer fundamental screening data, but…
… it will cost 70% less. Yes, 70% less.
Stay tuned to this channel.
Thanks for reading CML Pattern Finder.