


A Stock with Strength -- Twice, and a Failed SaaS Breakout

Preface
Today we will focus on two new screens which out of nearly 10,000 stocks select just one company… twice.
Then we look at a tech stock in the SaaS space that gapped up on earnings but has failed at resistance, the 200-day SMA, and rolled over.
Two Screens - One Stock
As we noted in our prior post, today we will finally turn to the idea of relative strength (RS). For some this is a tried and true indicator, for others it may be brand new.
Relative Strength measures the performance of a stock over a certain period of time (like 3-, 6-, or 12-months) versus a benchmark, like an index.
The final RS number is between 1-100, a rank, such that 100 is the best performer and 1 is the worst. For example, a stock with an RS 3-month of 80 would have performed better than 80% of other stocks in the last three-months.
We looked at two screens today, both which narrowed the stock world rather quickly, and both which resulted in the same stock.
Screen 1
Stock return over the last week is positive
Stock return over the last 10-days is positive.
Stock return over the last 4-weeks is positive.
In the last 30-days, volume on up days was more than twice as large as volume on down days.
Revenue in the trailing twelve months is at least $100 million.
Market cap is at least $500 million.
RS-Rating 3-months is at least 95.
Stock price >= $10
2,361 companies had a positive return over the last week, and by the time we reached our final requirement, we were left with one stock: NSSC.
Then we ran a second screen.
Screen 2
We added a few requirements and removed a few others, but must pressing is that we added an RS-Rating over 12-months, required the stock to be up on the day, and then added a fundamental metric — that the operating margin for the company be greater than that of the industry median.
The waterfall of metrics and results are included below.

The single stock that remained was again NSSC.
As for the overall fundamental view of this company, we took this straight from Chart Finder:

The company is profitable, growing revenue more than 25%, has a positive free cash flow margin, and the consensus analyst estimate is for revenue growth above 20% out to fiscal year 2025.
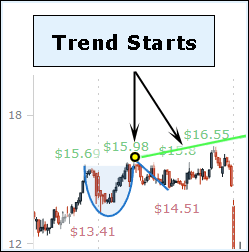
Finally, we look at the stock chart:

The stock is up 52% over the last 3-months and is right on a 52-week high.
Pattern Finder’s Trend Lines are automatically drawn. The green line is resistance, and starts at the top of the cup with handle, which is a CANSLIM pattern:

That resistance trend line is drawn to attach to the next high price after the completed cup with handle and rally, we extend it out to the current date.

The stock price is right on that resistance.
Finally, here are the pivot points, a clean way to look at critical prices that CML Pattern Finder also provides:

There are a lot of ways to play this stock. Ultimately, CML Pattern Finder is a charting and fundamentals web based software driven by a community of traders that share ideas, screens, and charts daily.
Now, on to a stock with a weaker chart.
Nutanix (NTNX) Ran into a Wall
Nutanix (NTNX) showed strength off of earnings but in the market swoon has shown yet more weakness.
Here is a chart:

The gap off of earnings was a thing of beauty:

But the stock peaked right at trend resistance (automatically drawn by Pattern Finder) which coincided with the 200-day simple moving average (SMA) drawn in dark blue.
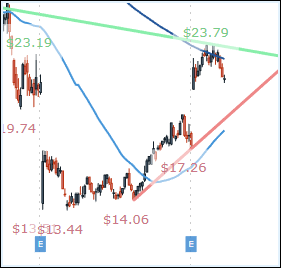
The stock may be ready to fill that earnings gap and retest the trend support line and 50-day SMA (drawn in lighter blue).
A bull market lifts all (most) stocks as a bear market sinks all (most) stocks. With a series of lower highs and lower lows and what appears to be a failure at resistance and the 200-day SMA, there are better looking charts than NTNX in the tech space in the immediate-term.
Again, CML Pattern Finder is a charting and fundamentals web based software, driven by a community of traders that share ideas, screens, and charts daily.
What’s Next
We will continue to share charts and screens with short discussions over the next few weeks before the CML Pattern Finder product becomes available.
The product will have everything IBD MarketSmith® has, a lot more, like algorithmically drawn support and resistance trend lines, built with better, faster, more flexible, and more responsive technology.
It allows for additional technical signals beyond just those offered by the CANSLIM methodology, far richer fundamental screening data, but…
… it will cost 70% less. Yes, 70% less.
Stay tuned to this channel.
Thanks for reading CML Pattern Finder.