


SPY breaks support; next trading levels; A bull market in a bear market


Today we review the most recent post from 9-14-2022 that discussed the shaky support in the S&P 500 and then turn to a segment of the market that is still showing relative strength with a new scan.
First, a look back.
S&P 500 (SPY)
On 9-14-2022 we wrote Understanding SPY Support on Inflation Data and led with this snippet:
The inflation data reading came in worse than expected yesterday morning and immediately took the SPY back to support with accelerating selling into the close making that support look ever so shaky.
We shared the chart below along with a zoomed focus of the support:

Zooming in on the support we saw this:

Pattern Finder automatically found the support trend line algorithmically, and we could also see that the index had fallen below the 50-day simple moving average (SMA), making for a rather tenuous support.
Five-days later we see that SPY did break support, and we share the broader chart along with the zoomed in region for support as of Friday’s close.
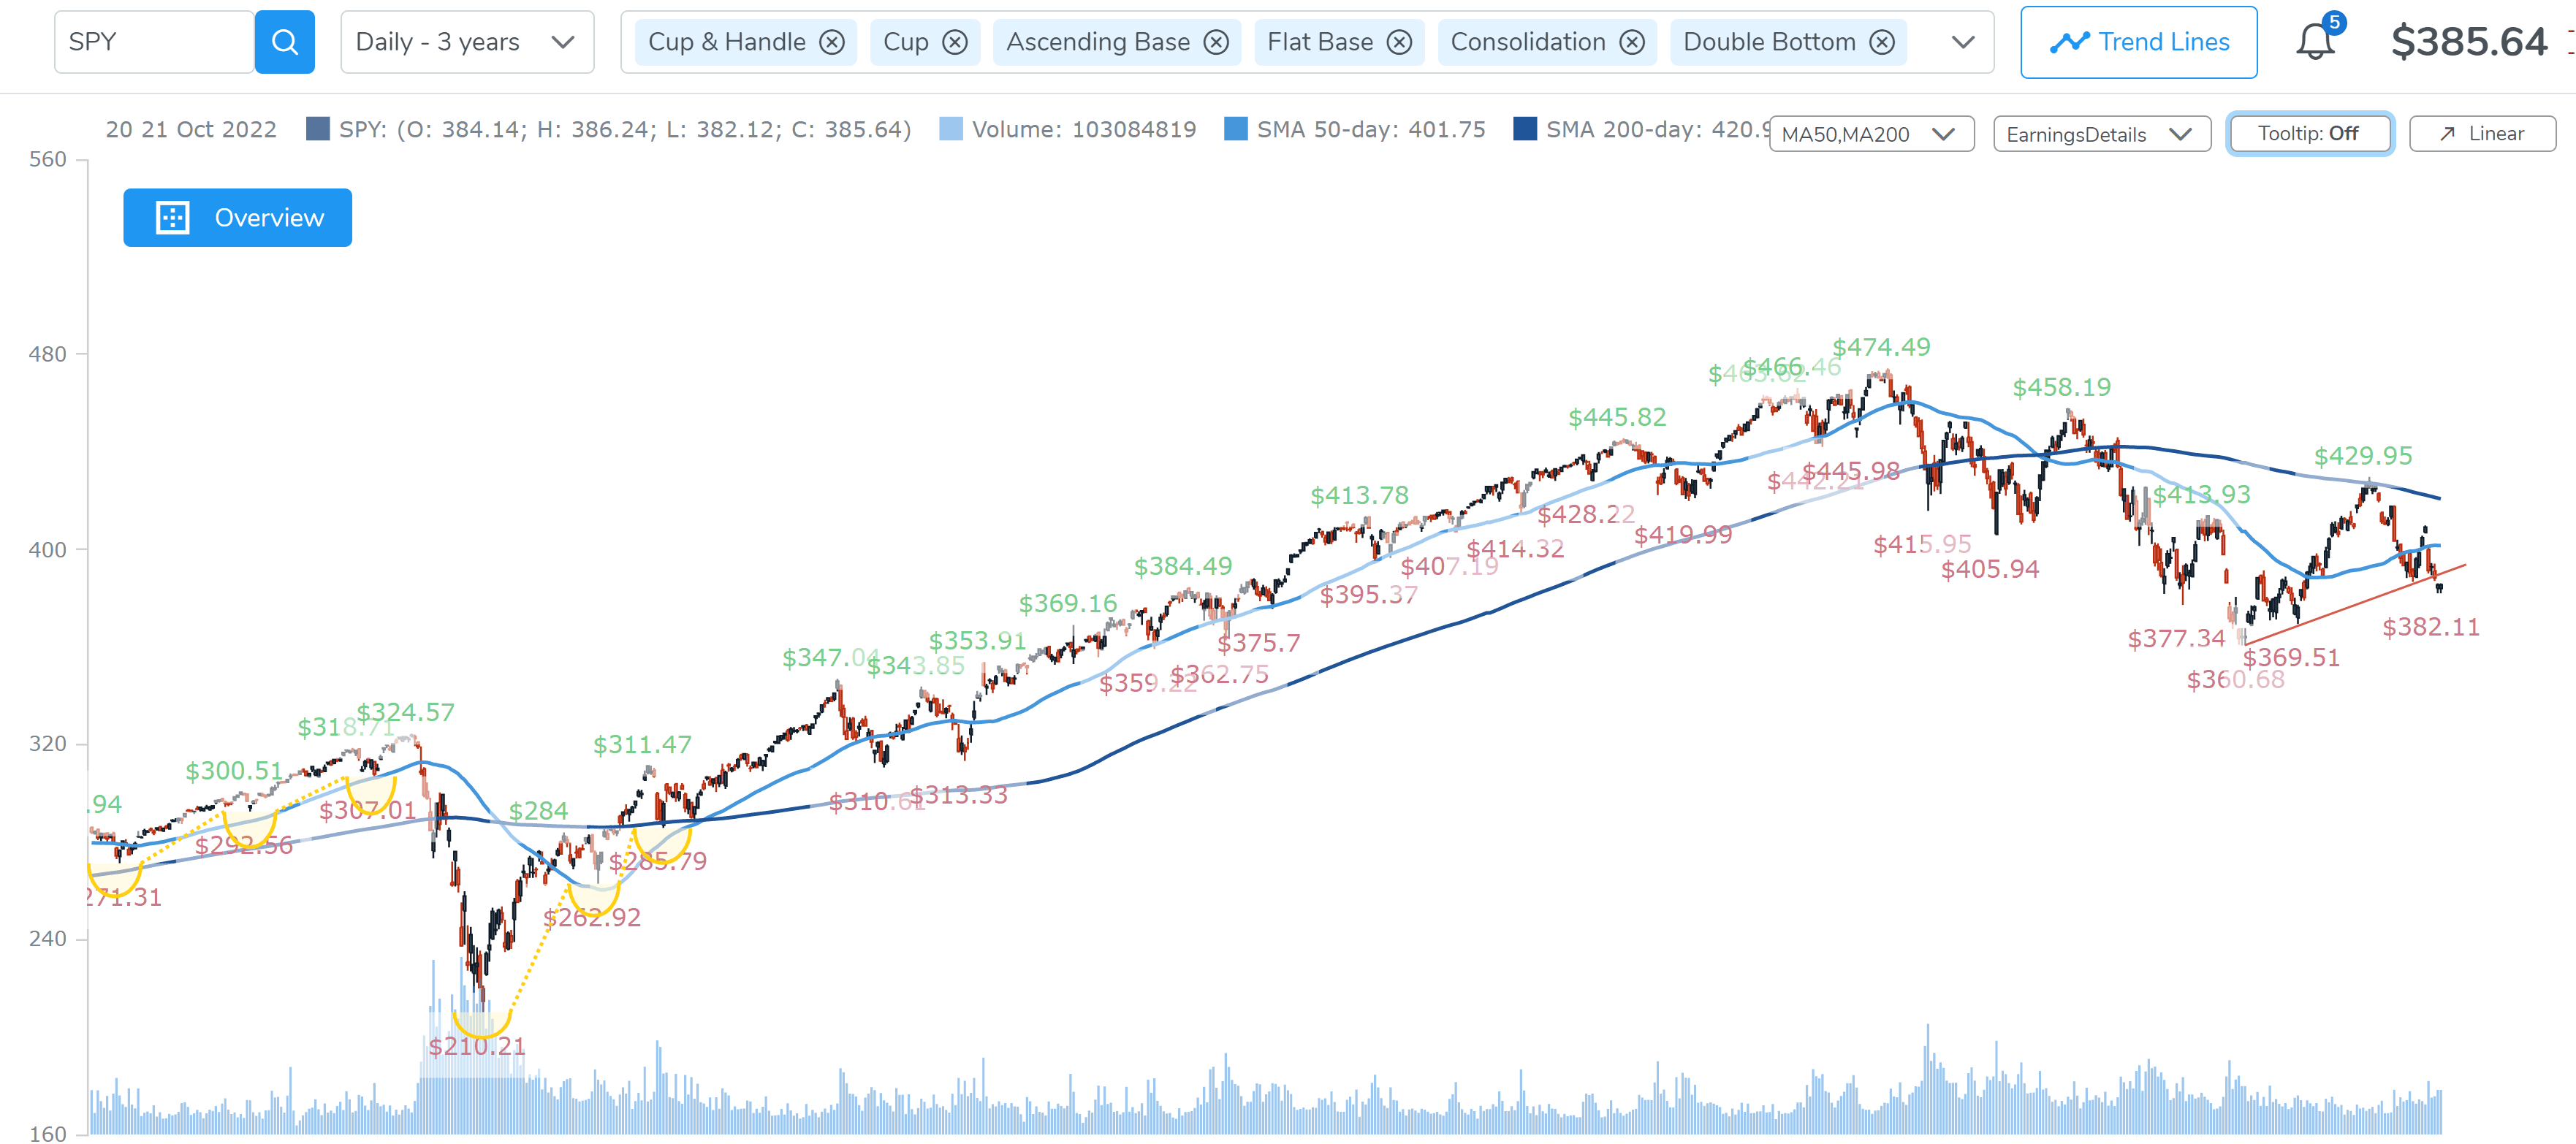
And the most recent portion is here:

Fortunately Pattern Finder already identified the next logical support levels if the shaky line was violated and the chart pointed to
The swing trader that was long into the CPI print likely stopped out at that support. Here was Pattern Finder’s next logical support drawn on the chart:

The algorithm passes through the low of the beginning of an ascending base (a CANSLIM bullish pattern) that began back in March 2020’s COVID lows. It passes through the series of recent lows, and gives us a $378 next support.
With the index in technical failure, we would have to look at the 52 week low or even the Fibonacci extensions to get the next support.
Here is the pivot point chart from Pattern Finder which shows both in a scatter plot format for quicker access.
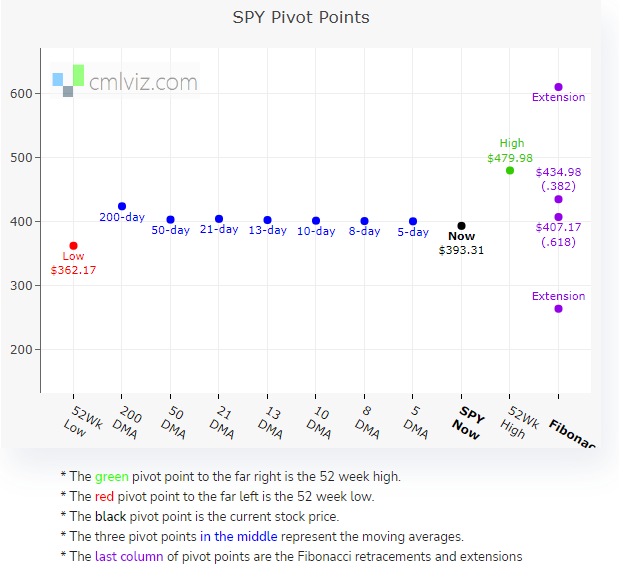
The 52 week low is down at $362 and the Fib extension is below that.
So, here we are. For shorts that took the support breakdown as an entry, the $378 level could act as a profit zone. For longs, that could act as an entry.
For those more bearish, the 52 week low of $362 would be the next logical pivot points.
But, there is always a bull market somewhere, and today we look again at a new screen that finds that area, and then a list of long candidates.
New we look for a bull market in a bear market with a new screen.
New Screen for Price Strength
Today we use the screener for another flavor of a bullish screen, but still hold off on using relative strength (RS) explicitly, but rather make use of the mass data available to us in Pattern Finder’s screener.
As we progress in these posts, we will dive into RS, what it means, how to use it, and how it can find bullish trends, bearish trends, and pair trades.
Our screen today has the following requirements:
The 4-week stock return is greater than 5%.
The 10-day stock return is 3% or greater.
Market caps above $500 million.
Revenue above $100 million.
The stock change relative to the S&P 500 over 26 weeks shows substantial outperformance.
The 10-day SMA is greater than the 21-day SMA which is greater than the 50-day SMA (a short stack).
The 50-day SMA is greater than the 150-day SMA which is greater than the 200-day SMA (a long stack).
You can see the screen and the waterfall of results as each criterion is added to the screen:

We are left with 26 companies that satisfy these results.
Soon we will be revealing the screen results to all of our posts here on substack, but for now, as we near product release, we’ll just pluck a top performer out of the list, in this case Enphase Energy (ENPH).
Here is the chart and then some discussion.

ENPH has been on a tear but has hit resistance near where Pattern Finder’s trend resistance line was drawn.
The automatically drawn trend support actually shows substantial room to fill the gap and even the 50-day SMA (the blue line) has some room.
While ENPH has been on absolute fire, we use this example as a chart that may have the swing trader in “plan” mode rather than trade mode.
The rising 50-day SMA could act as a an entry for a swing trader. The profit zone could be the rising resistance and the trailing rising support line could be the stop.
In technical swing trading, the plan is as important as the stock trade itself, and we use this screen and stock as an example of one possible plan build entirely by the chart and Pattern Finder’s automatically drawn trends.
We also note, that while it’s too early to say, a new ascending base could be forming, which is a CANSLIM bullish pattern that Pattern Finder also has programmed into it.
We hope you have enjoyed this quick discussion and that you are as excited as we are about the release of Pattern Finder soon approaching in late October.
What’s Next
We will continue to share charts and screens with short discussions over the next few weeks before the CML Pattern Finder product becomes available.
The product will have everything IBD MarketSmith® has, a lot more, like algorithmically drawn support and resistance trend lines, built with better, faster, more flexible, and more responsive technology.
It allows for additional technical signals beyond just those offered by the CANSLIM methodology, far richer fundamental screening data, but…
… it will cost 70% less. Yes, 70% less.
Stay tuned to this channel.
Thanks for reading CML Pattern Finder.