


Agriculture Commodity Breakout; TSLA Key Prices


Lede
Last week we wrote Charting the S&P 500 Rally; Agreement on Upside; Next Key Points, with a focus on the S&P 500. Today we look at an agriculture ETF that may be breaking out and then TSLA and its next key levels (up or down).
Agriculture Commodities (DBA)
We plucked the DBA ETF out from the Pattern Breakouts Tab and note that yesterday it broke through 18-month resistance.
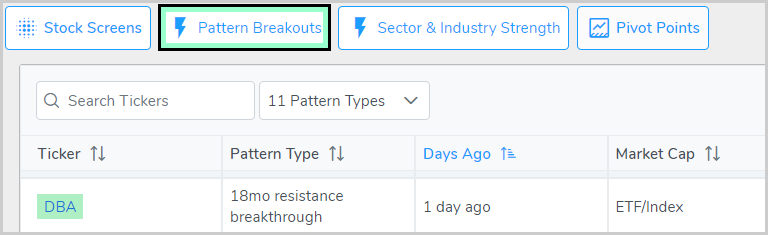
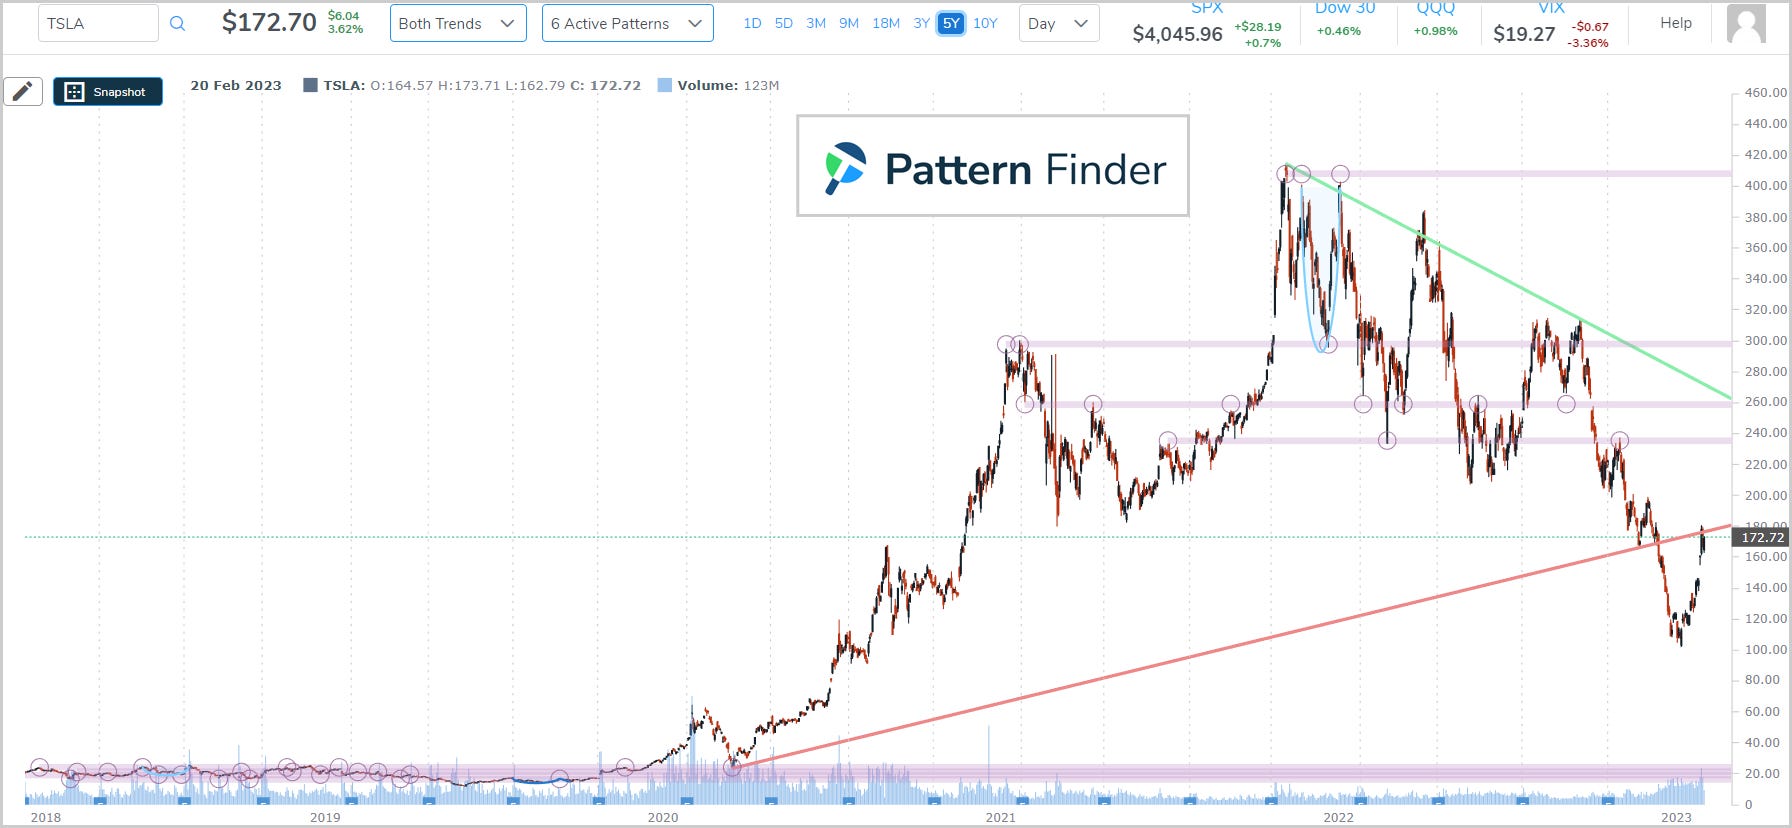
We start with the 5-year chart using daily candles. We ask Pattern Finder to draw in trending resistance (green line), trending support (red line), and points of congestion (pink lines).

Even though we found DBA due to an 18-month resistance breakout, we see that the 5-year chart is quite compelling as well, with the price bouncing off of congestion and back up through support quite recently.
We zoom in for clarity.

Next we turned to the 18-month chart which triggered the breakout:

In this image we see a thrust higher in price, eclipsing trending resistance and now right at a recent top. Let’s zoom in to see it more clearly:

A trading zone could be constructed that uses trend resistance (green line) as a loss zone and the next point of congestion (pink line) as the profit zone. We do note that the price is right on the recent peak.
Tesla (TSLA)
There has been a lot of interest in TSLA of late, so we turned to that chart, starting with the 5-year. It’s hard to miss how large the recent drop was, how much it violated support, and how abruptly it came back.
We can zoom in on this chart:

The question now is whether that was a short-term violation of support, or the start to a new trend with the recent recovery nothing more than a head fake.
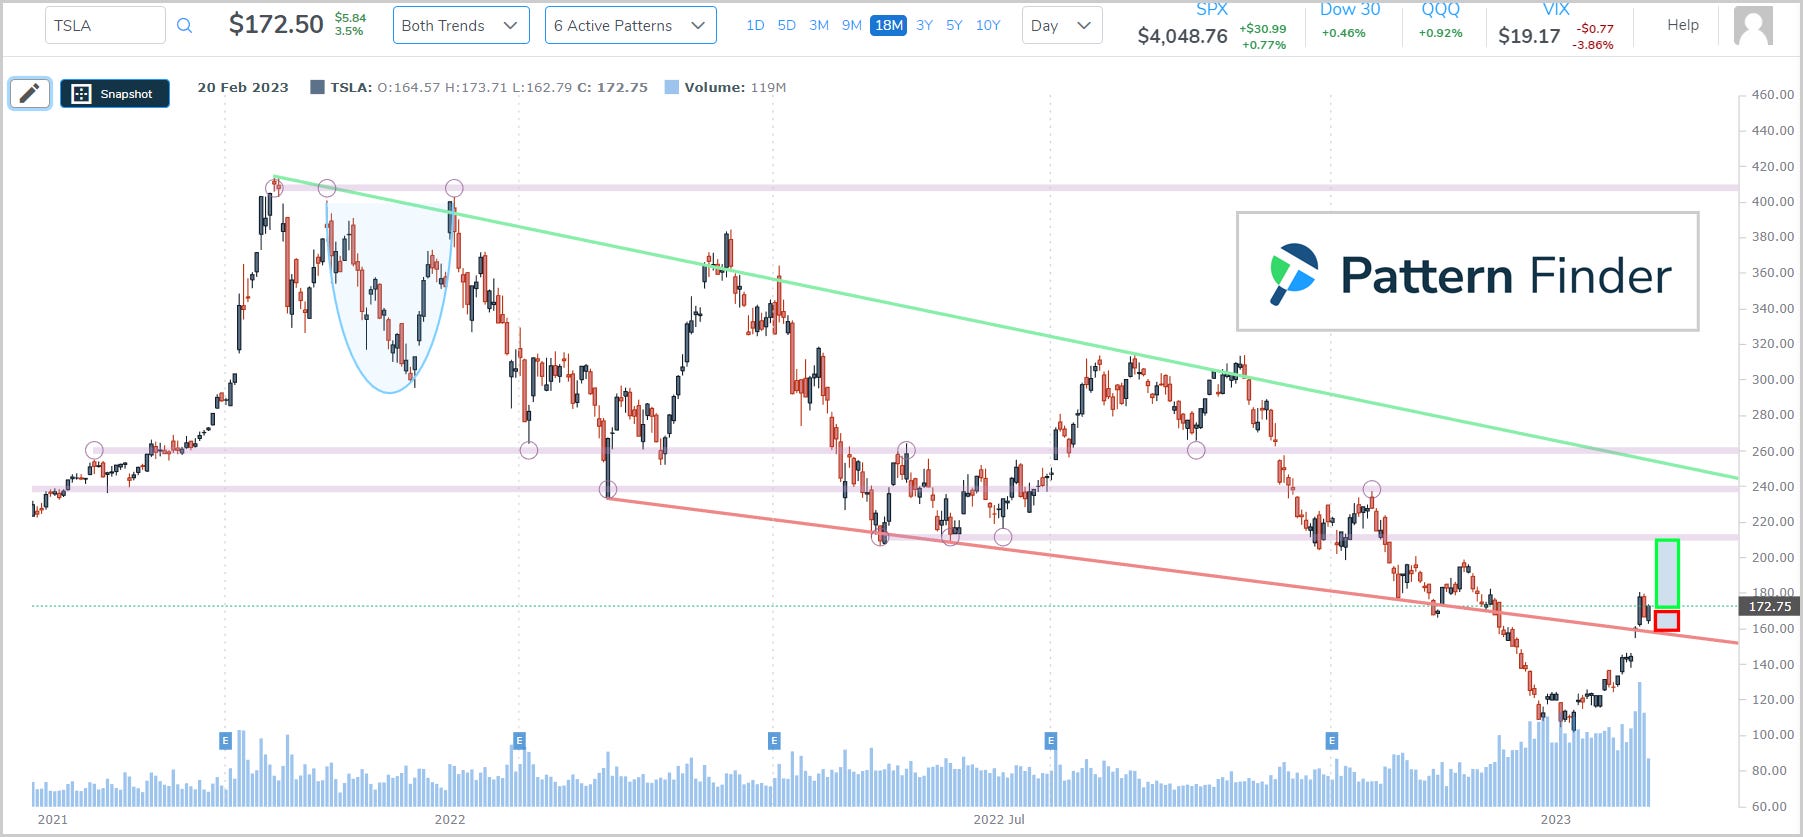
So, we turn to the 18-month chart, and this time draw in some trading zones, with the loss zone going to 18-month support and the profit zone going to the next point of congestion:
If we zoom in, the prices are clearer:

A loss zone down to ~$150 could be a stop with an ambitious profit zone set up to ~$210.
Ultimately the long-term chart guides this shorter-term chart for traders: was the recovery to support a false failure or is TSLA in a new regime where support is far lower? We’ll let each of you decide!
Conclusion
Successful traders understand the importance of staying informed about market rumors, macroeconomic forecasts, inflation, and other factors that can affect trading outcomes and macro will dictate DBA and likely TSLA as well in the short-term.
All of these are all reflected in a stock chart.
However, sifting through this vast amount of information can be a daunting and time-consuming task, which is why we at Capital Market Laboratories have developed a revolutionary tool: Pattern Finder.
With Pattern Finder, we empower traders to take control of their investments by simplifying the process of understanding stock charts and screening for profitable trades just like we did today with DBO and TSLA.
We are thrilled to see that our members are finding success with Pattern Finder, and we are committed to providing ongoing support and resources through our platform and trading community.
We invite you to discover the benefits of Pattern Finder for yourself by visiting our website to learn more: Learn about Pattern Finder
Thank you for your continued support and trust.
Very cool , especially the Tesla charting, definitely going to watch Tesla for a trade after the FOMC meeting tomorrow ;-))