


Pattern Finder: Rising Stocks with Institutional Volume and... a Tech Stock Chart

Today we will start with another tech stock chart and patterns and then quickly move to a custom screen that identifies stocks with outsized institutional buying volume and outsized returns because of it in places most retail investors never look.
First it’s chart time…
Chart Time: Datadog (DDOG)
One stock to watch for next week is Datadog (DDOG), a battered tech darling.
Let’s start with a whole chart, and then zoom in.
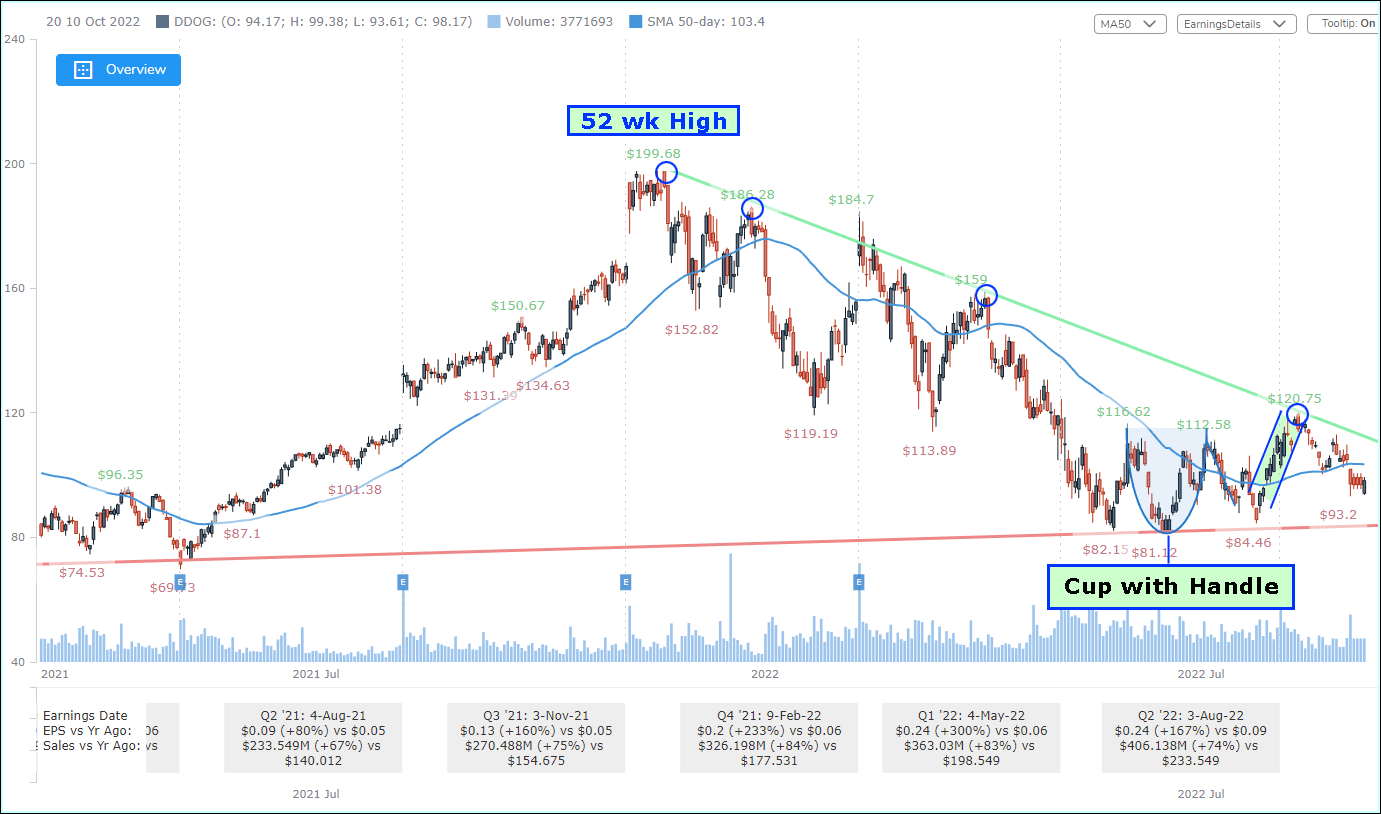
We start with the resistance line in green which is automatically drawn by Pattern Finder.
It starts at the 52-week high ($199.68) and passes through the next lower high ($186.28) and conveniently, this algorithm also accurately marked the resistance at $159.

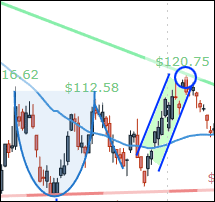
But, most importantly, the trend resistance was a good exit signal at $120.75 from the start of the cup with handle that initiated at $93 and saw a $30 stock move in just three weeks.
DDOG also recently fell below its 50-day moving average (the blue line) and now rests at about $97.
This is one of our stocks to watch for next week because any strength above the 50-day MA and also through that resistance trend line could signal a break out to the upside that the bulls have long hoped for.
Failure to do so likely means more sideways or even downside trading.
The support line passes through the bottom of the cup in the cup with handle formation that led to a bullish trend.
Datadog (DDOG) is on watch.
All of this is automatically done by CML Pattern Finder.
Datadog is just one use case and pattern developed by Capital Market Laboratories (CML) Pattern Finder out of dozens.
Screening the Unscreened: Rising Stocks with Up-Volume, Institutional Buying
Next, we look at our first demonstration of Pattern Finder’s screening capability.
We did a narrow screen for stocks with substantial buying interest in areas normally uninvestigated by retail traders and therefore with volume driven by institutions.
Here were the requirements:
1. Average daily stock volume is at least 500,000.
2. The ratio of up volume to down volume over the last 30-days is at least 2.0:1.
3. Market Cap at least $1B.
4. In the Utilities, Energy Minerals, Non-Energy Minerals, or Industrial Services sectors – the “not sexy” sectors.
5. Operating margin greater than the industry median.
6. Positive free cash flow (FCF).
You can see how the list narrows by requirement, going from over 2,600 companies down to 4.

And finally, here are those results as of the close of trading on 9-8-2022:

Not surprisingly, we have found four stocks that are up on the year, with all four being up 20%+ and 3/4 up 40%+ over the last year.
There are buyers out there, we just need to find what they are buying, and we won’t find them on Twitter.
The screen is a simple use case — just an example — which utilizes only six metrics out of 150+ metrics available to members.
What’s Next
We will continue to share charts and screens with short discussions over the next few weeks before the CML Pattern Finder product becomes available.
The product will have everything IBD MarketSmith® has, a lot more, built with better, faster, more flexible, and more responsive technology. It allows for additional technical signals than just those offered by the CANSLIM methodology, far richer fundamental screening data, but…
… it will cost 70% less. Yes, 70% less.
Stay tuned to this channel.
Sharing is caring!
Last Time
On Wednesday 9-7-2022 we wrote:
Apple (AAPL) and Global-e (GLBE) here: AAPL, GLBE at critical support