Several Chart Breakouts and Breakdowns into Earnings Season
Lede
Today we’ll look at just three charts, but more importantly, note that with the recent rally in the market and earnings season approaching, there are several bullish and bearish setups presenting themselves in any number of screens.
An extra note that a trader should be aware of earnings dates in trading positions to manage risk.
Start With Strength
We’ll look at charts with strength and then pivot to charts with weakness.
We’ll alter our screen from the prior post The Mechanism Behind Breakout Charts - And How to Find Them Early to intentionally find stock charts that are not only showing strength in the intermediate-term, but prior to that were weak.
Here is the screen set up:
Note that different from the prior post, this time we require that the 12-month RS (relative strength) is weak (between 15-40 out of 100). This should give us stocks with intermediate- and short-term strength but with longer-term weakness so the upward move may still have room.
We plucked EEFT out and start with the 5-year chart.
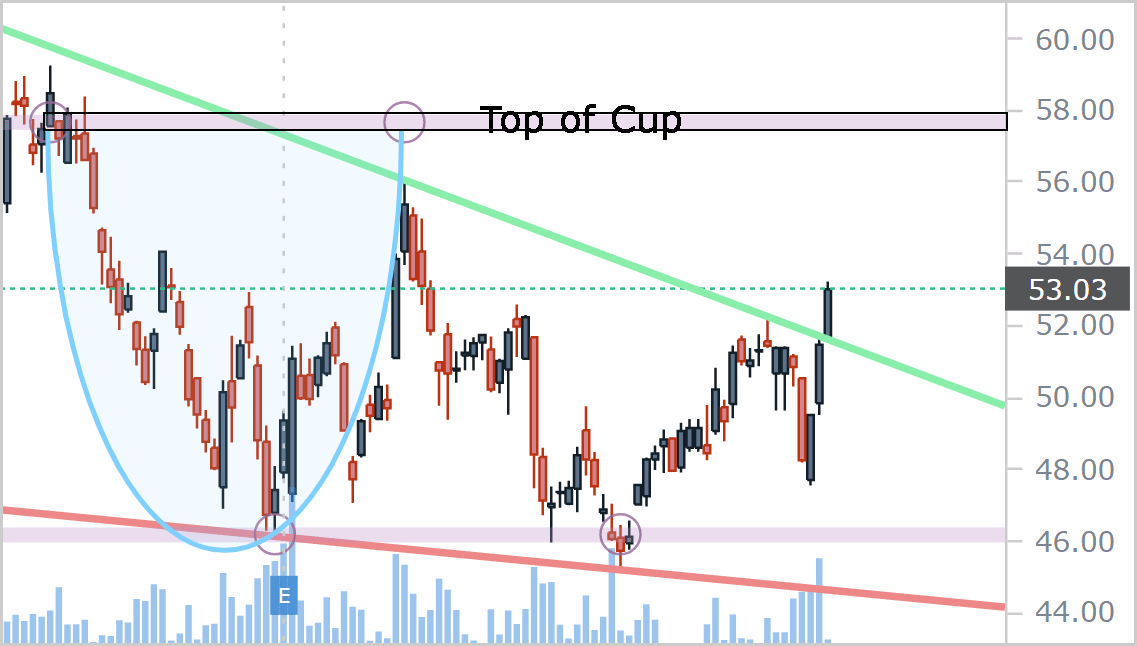
Note the cup that formed several years ago and that its base is now support for the current price.
(The trend support (red line), trend resistance (green line), congestion lines (pink), and CANSLIM shapes are all automatically drawn in by Pattern Finder.)
We can look at the 3-year chart as well, before we zoom in, and we also have Pattern Finder remove its pivot point prices from the chart.
It’s clearer now where a short-term breakdown would head — the nearest congestion line (pink line) below the current price while the ambitious upside could be to trend resistance (green line).
Now we zoom in and draw those profit and loss zones:
We encourage any and all traders to check out the entire results from that screen.
Next we turn to the ‘Pattern Breakouts’ Tab and look to stocks breaking through resistance.
There are several good looking charts, but we plucked out ZION as an example (a bank).
Here is the 18-month chart and the stock breaking through resistance. We note a recent cup where the base can act as support and the top can act as an ambitious bullish profit zone.
Next we zoom in for clarity:
Turn to Weakness
We then turned to a pre-built screen in Pattern Finder for some bearish charts:
This is another screen with some very nice setups, this time on the bearish side. We plucked PCRX out, right on support. Here is the 18-month chart.
We can zoom in as well:
Earnings season is upon us, and so too here comes the volatility (on both sides).
For completeness, here are the entire results of this pre-built screen; you can note the substantially weak numbers in our ‘Buy-Sell’ rating, which ranks stocks from 1-100, where 100 is the greatest buying strength and 1 is the greatest selling strength.
Conclusion
It’s a good time to be a short-term trader, and it’s even better if you can do it with Pattern Finder.
We truly hope you are enjoying using Pattern Finder and our posts and see how easy it is to improve your trading and we hope you are learning as well.
Get Pattern Finder, join the trading community, and more, below:
Thanks for reading, friends.


