

SPX Update; Recession 'Proof' Stocks; Heavy Bearish Volume Stocks
SPX Update; Recession 'Proof' Stocks; Heavy Bearish Volume Stocks

Lede
Today we continue our charting analysis of the broader market (SPX), then look at various screens: recession and inflation ‘proof’ characteristics, upside relative strength breakouts on heavy volume, heavy selling volume, and one stock specific chart.
The Market - SPX
Last week we posted one of our most interesting market updates “S&P 500 - Automatic Adjustment to Support Just Occurred in Real-time; Why it Matters”, where in real-time the trending support algorithm in Patten Finder (this product) shifted lower, indicating higher odds of a lower market in the near-term.
That post made this chart relevant, for those of you that like to understand the guts of algorithms:
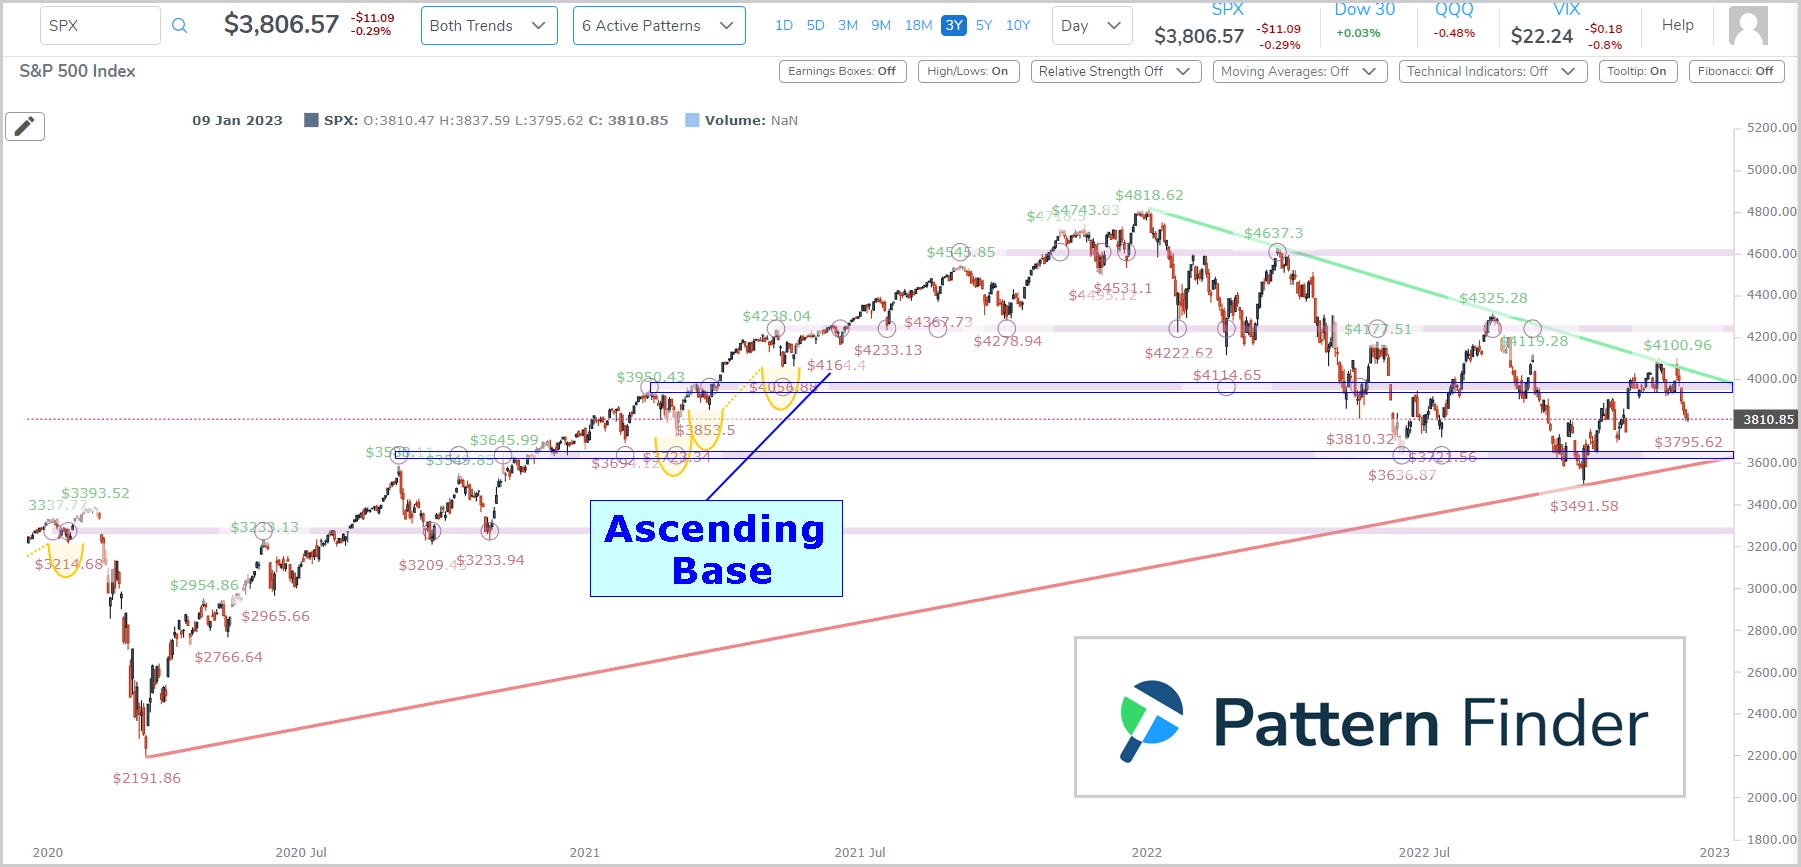
The SPX has dropped about 2.5% in the week following that post. Now we can look to an update, starting with the 3-year chart.
The ascending base pattern, trend support (red) and resistance (green) lines as well as the congestion (pink) lines are automatically drawn in by Pattern Finder:
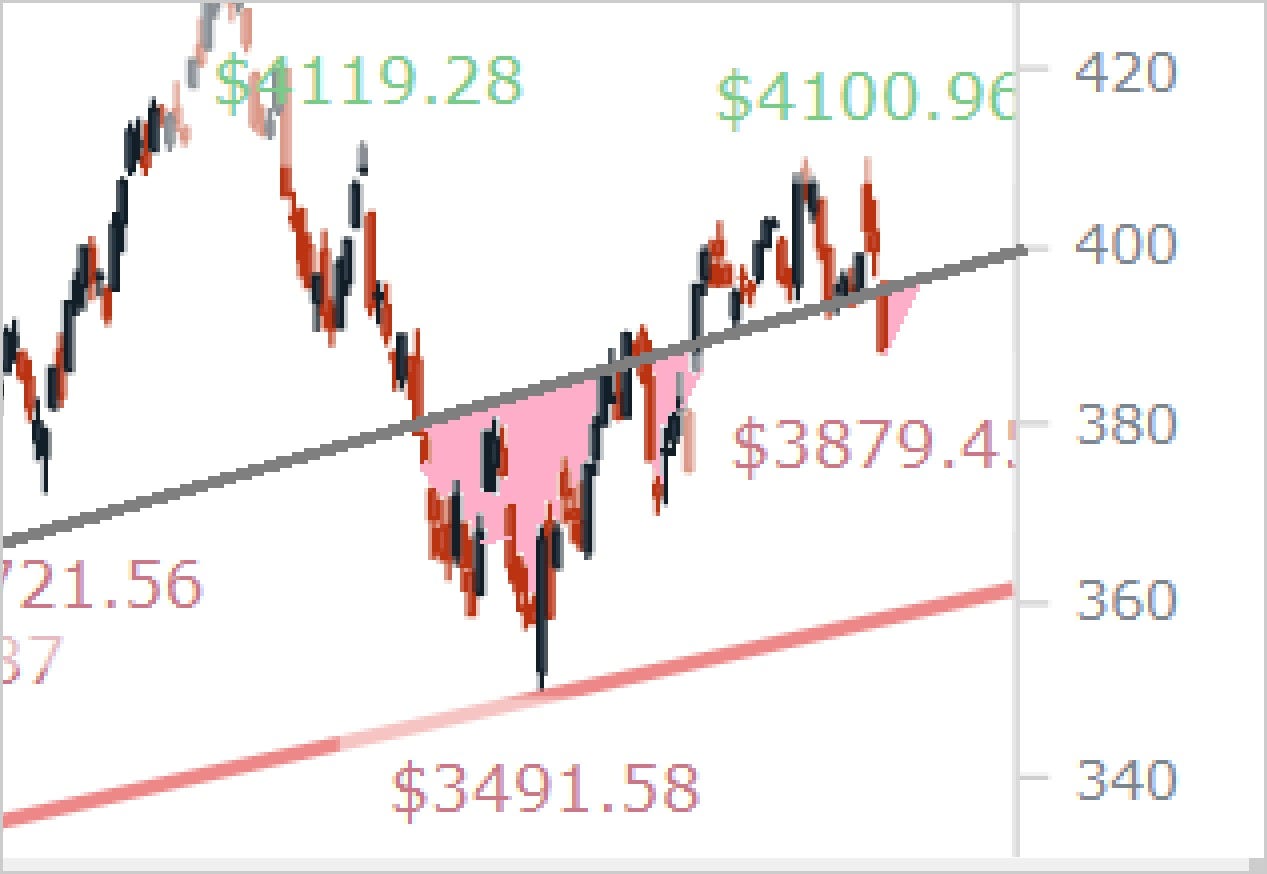
We have outlined the top and bottom lines of the ascending base which highlights near-term support and resistance for the index. We can zoom in, twice for more clarity:
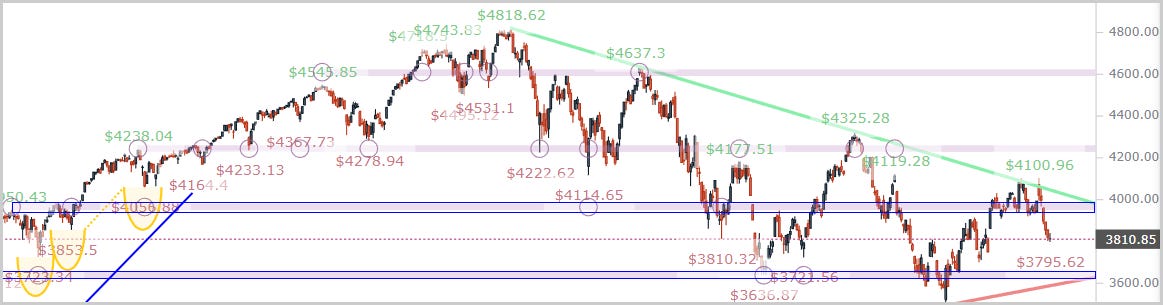
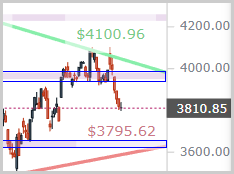
And then even tighter:
The Fed’s forecast (through the dot plot) for yet higher rates all the way through the end of 2023 in the face of dropping inflation and an economic slowdown has weighed on the market — and it should, unless or until there is a revision of those Fed forecasts.
It’s been tough sledding for longs and even in the near-term it has persisted all due to macro factors driven by inflation and the Fed’s response to it.
To see just how rough it has been, we share the ‘Industry and Sector Strength’ tab from Pattern Finder with one-week median returns. Every sector in the S&P 500 has shown a median negative return over the last week.
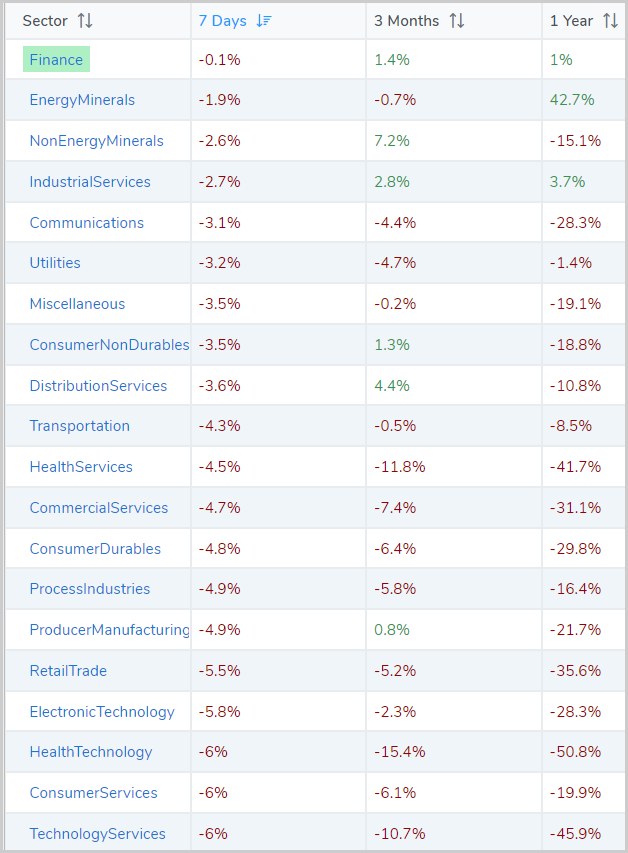
This does signal rather heavy, and perhaps, over done selling in the near-term, but caution to the investor that bets against a falling market into thin volume during the holiday season. (Happy holidays, btw!)
RS Breakouts on Heavy Volume
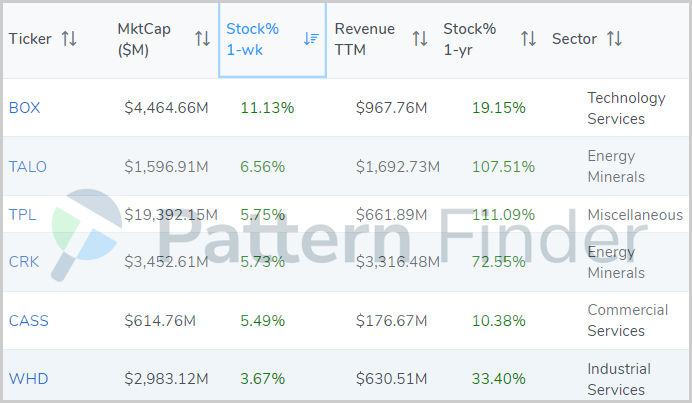
There have been some individual names showing strong relative strength recently, and we share those from a pre-built screen in Pattern Finder:
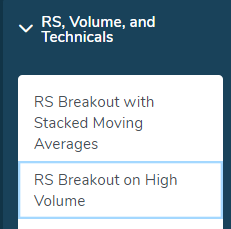
And the filters:
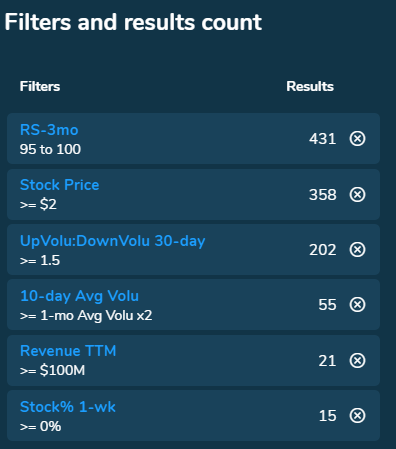
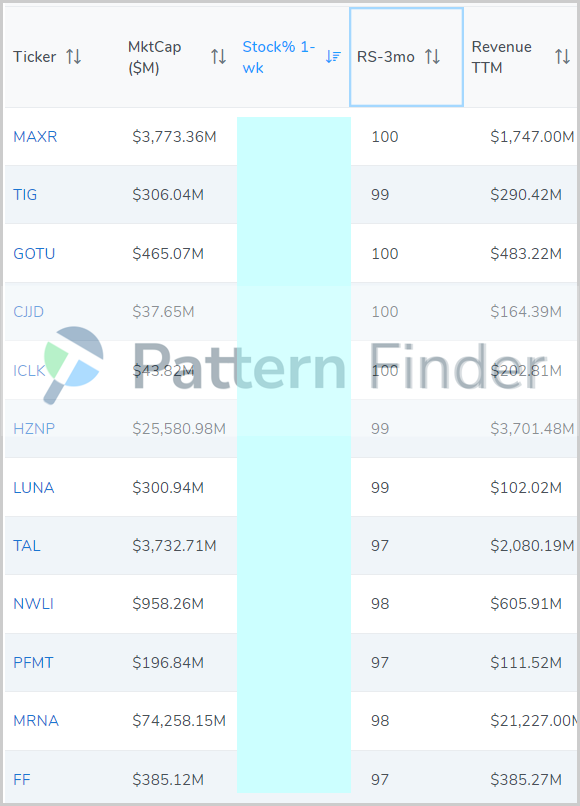
We’re looking at just 15 stocks with a 3-month RS above 95 (out of 100), that also have up volume at least 50% larger than down volume over the last month, with heavy 10-day volume (at least 2x average) and are up on the week.
Here is a snippet of the results:
And we also provide a heavy selling volume.
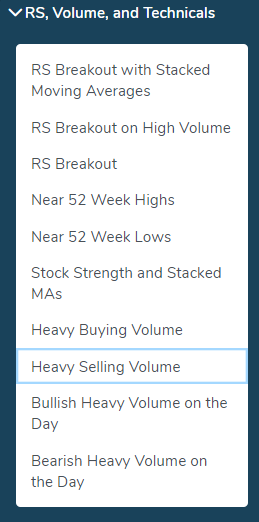
The filters are here:
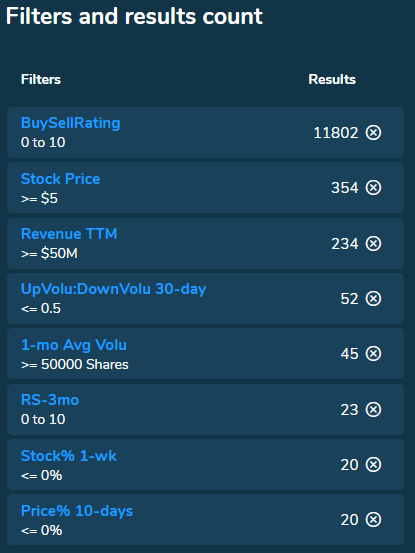
We leave the chart work on these for the readers.
Next we turn to characteristics of companies that could withstand a recession and an inflationary environment.
Inflation and Recession ‘Proof’
That phrase evokes far too much comfort for a portfolio, so we use the word proof in quotes. Here’s what we built:
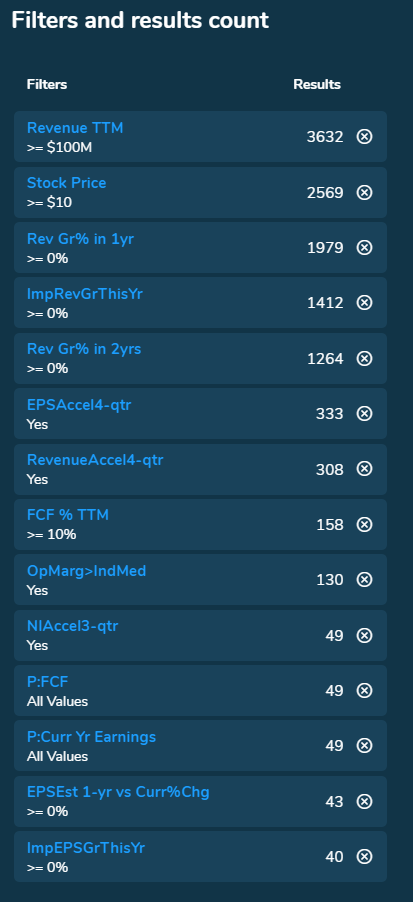
We want companies with revenue growth (any amount), EPS growth (any amount), those with revenue and EPS growth embedded in next year’s analyst estimates, accelerating revenue growth, accelerating EPS growth, free cash flow (FCF) margin above 10%, and an operating margin above the industry median.
Here is a snippet of those results:
And we pluck CASS out of the list for some chart analysis. We start with the 5-year weekly chart:

CASS has recently gone up to and through 5-year resistance, with a look at filling a prior gap.
Let’s zoom in a bit:
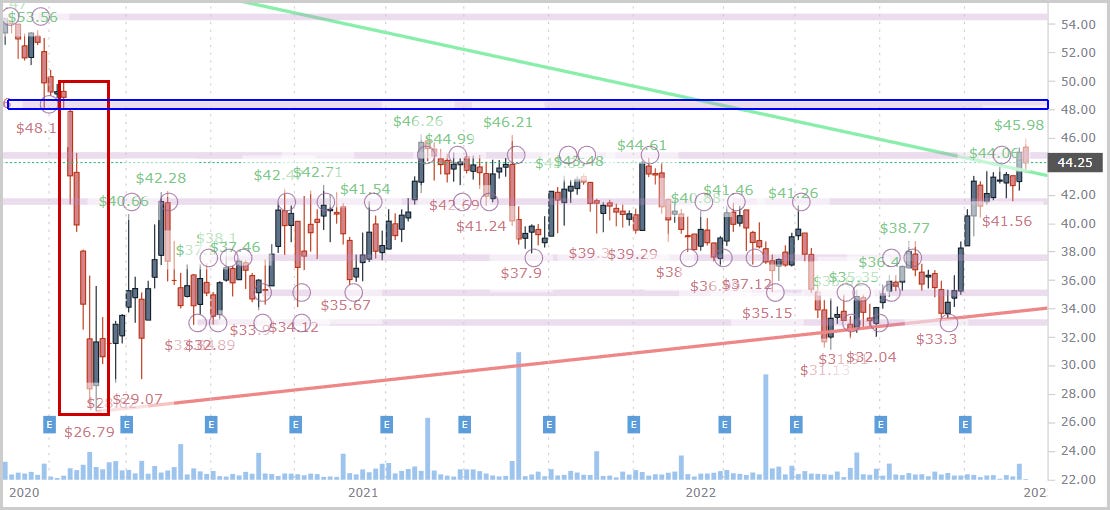
We have emphasized the congestion line from the top of that gap. CASS would have room to the $48 range with a stop likely at the $42 range.
With a current price of $44, there actually is a bit of a reward:risk ($4:$2) benefit; albeit tentative in this market
Alright, that’s our post for the day!
Conclusion
We truly hope you are enjoying using Pattern Finder and our posts and see how easy it is to improve your trading. It’s better than anything else out there (in our opinion), and we continue to demonstrate why.
See Pattern Finder in action, below, before the price hike in Jan 2023.
Thanks for reading, friends.