


Strength in Health Care and... China?

Lede
Happy New Year, friends.
In the prior post we dove into the oil and gas world. Today we do a similar exercise in the health care space — another sector that has historically been relatively resilient during recessionary periods.
Then we look at recent breakouts and end up with… Alibaba (BABA)?
Health Care
We start on the ‘Sector and Industry Strength’ Tab, and focus just on those that are up in the last week.
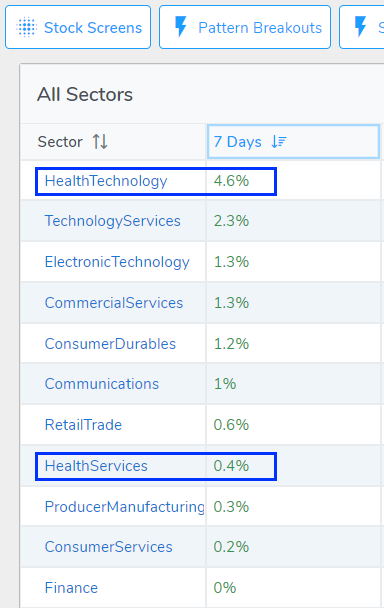
We can see that two health related sectors make the cut.
The next step was to build a screen inside the health related sectors and then a lot of fundamental requirements:

If you peruse that screen you can see that we are resisting the urge to look at charts of companies that don’t have some rather substantial fundamental requirements like revenue growth over multiple time periods including forward looking estimates, positive free cash flow (FCF), operating margins better than their peers, and even balance sheet strength with the current ratio.
That screen yielded us 10 stocks:

Of that list, we plucked two out that were right at resistance.
We start with ticker BRKR and a three-year chart.
We let Pattern Finder add all of the fixings - trend support (red line), trend resistance (green line), congestion lines (pink) and CANSLIM patterns (dark blue).

BRKR has upward trending support but downward sloping resistance, which is a fancy way of writing higher lows but lower highs. The stock is right at resistance and even a little through it. Here we zoom in:

To set up a trading zone, we went to the 9-month chart:

One could hypothetically look at trend resistance (which is rising in the 9-month timeframe) as a limit and trend support as a stop. To me, this chart looks ‘OK,’ but hardly exciting.
Next we turned to DXCM and the 3-year chart with Pattern Finder fixings turned on:

This is another health sector stock right at resistance, but it has a bit more panache, with an ascending base just completed and a reinforcing cup right behind it.
We can zoom in:

When we turn to the 9-month chart, a trading plan emerges:

We can use the current congestion from the last base of the ascending base as a stop, call it a 3% stop, and then use trend resistance as the limit.
This is a slightly better looking chart than the prior health related stock when applying very tight stops.
A 10-year chart (using monthly candles) illustrates that DXCM is at critical support, which is good news for the optimist (a bounce is coming) and bad news for the pessimist (look out below).

China?
We then turned to a sector agnostic approach and look for stocks breaking out of 18-month resistance. Much to our surprise, we found Alibaba (BABA).

So, we took a look at the 18-month chart:

We drew in a loss zone back down to trend resistance and a limit profit zone to the nearest congestion line, although a more ambitious trader might choose to use the peak in July of 2022 (~$123) as the limit.
We zoom in for clarity:

Of course, China has many exogenous factors that go beyond what a chart may or may not be able to reflect, so trader ‘beware,’ or at least trader ‘be aware.’
That’s it for today!
Conclusion
We truly hope you are enjoying using Pattern Finder and our posts and see how easy it is to improve your trading.
See Pattern Finder in action, below:
Thanks for reading, friends.
Great read
Great article!