


Tech stock rises with support; new heavy buying volume hits another stock


Today we focus on two charts – one a reprise from the post on 9-6-2022 and the second a tech stock from a custom screen I created looking for tech stocks with buying volume and a slight up trend.
First, we look back before we look forward.
Global-e (GLBE) – When Support Holds
On 9-6-2022 we wrote AAPL, GLBE at critical support.
We noted the following with GLBE stock at $29.02:
1. We saw cup and a lower low; which is a failed bullish attempt ending at $66.78.
2. Next, a downtrend where the stock dipped all the way below the 50-day moving average, then rose above it with the July rally.
3. Finally, a failed rally with a small double top at $37.65.
The stock is now above the 50-day SMA but below 200-day SMA and right on our algorithmically drawn support.
Here is the chart from 9-6-2022:
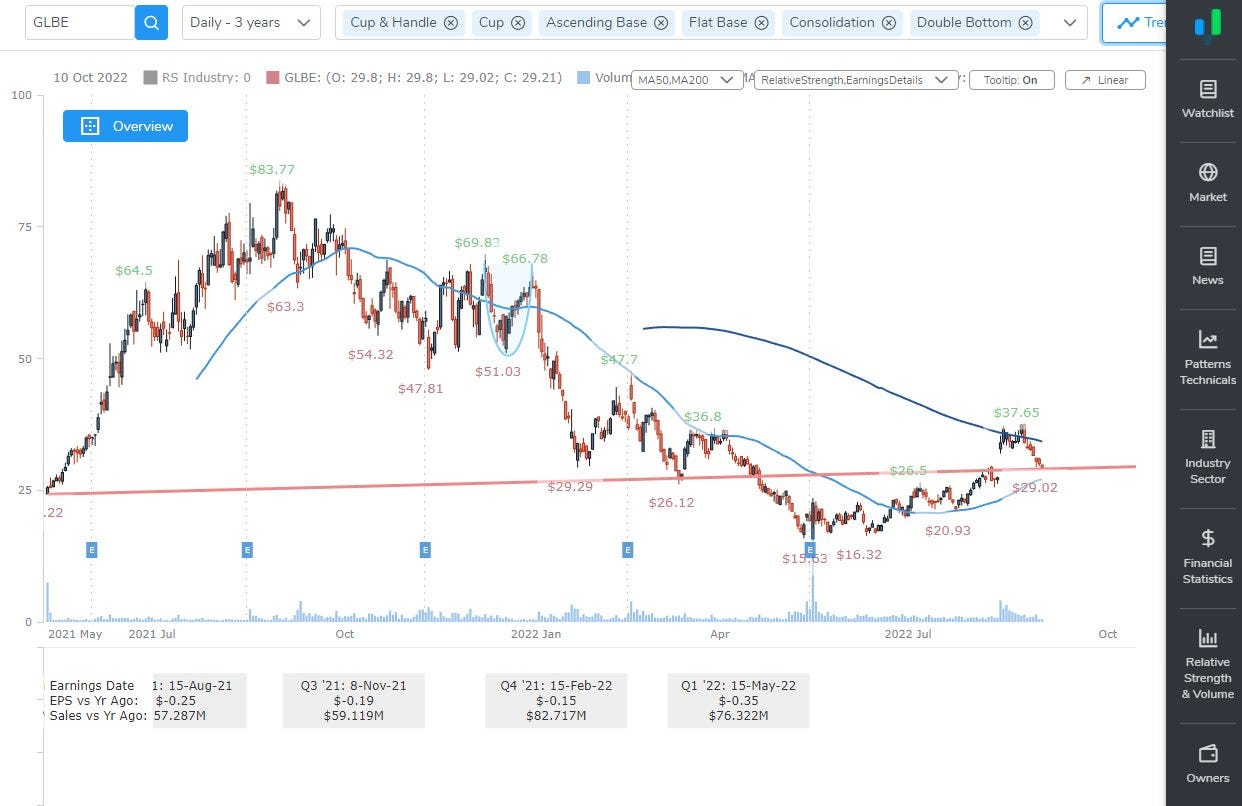
Notice the stock right at top of the trend support that Pattern Finder draws (automatically).
A week later, on 9-12-2022, that same chart looks like this (simply note the move over the last several trading days).
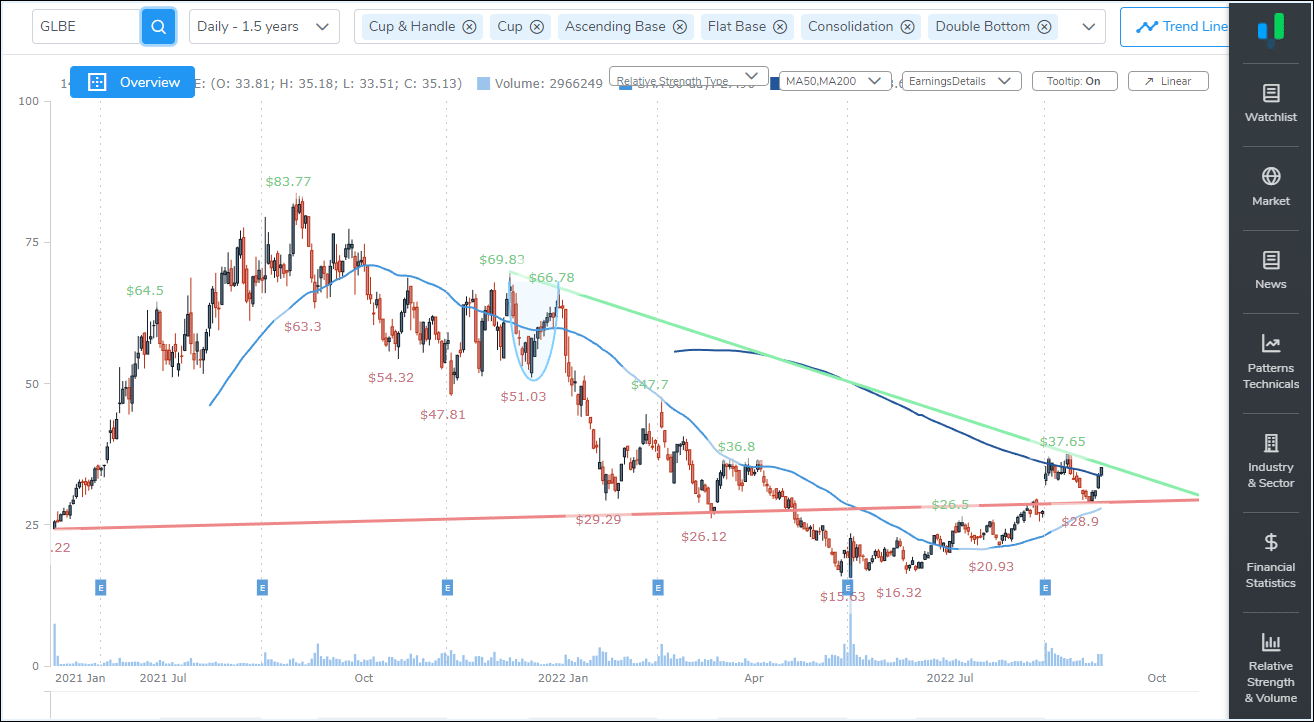
GLBE did bounce off of the support and then rose 20% in less than week.
The trend resistance (the green line), which also algorithmically drawn for members, may act as a nice profit zone (the stock is there) for the short-term swing trade and the rising support trend can act as the stop.
Next, we turn to a scan and a new stock.
New Tech Screen with Buying Volume
We created a quick new screen that required the following:
Over the last month, volume on up days must be at least twice as large than on down days.
Revenue growth in the last year must be at least 30%.
Revenue over the last year must be at least $100 million.
The sector must be technology.
Please find the screen and the corresponding counts per filter below.

The stock that caught our eye was Paycom (PAYC).
Here is the chart before we discuss it:

We found a stock that bounced off of the trend support (the red line), which coincided with the stock touching the 50-day simple moving average (SMA) (the blue line).
Here is a zoomed in look of that moment:

Buying volume was larger than selling volume over the 30-days at more than a 2:1 clip, and the stock that bounced off of support and the 50-day SMA at the same time.
A trader that identified this with the scan early could now see a natural stop on the rising support line and a natural limit gain at the recent peak above $400.
All of these trend lines are automatically drawn for members.
What’s Next
We will continue to share charts and screens with short discussions over the next few weeks before the CML Pattern Finder product becomes available.
The product will have everything IBD MarketSmith® has, a lot more, like algorithmically drawn support and resistance trend lines, built with better, faster, more flexible, and more responsive technology.
It allows for additional technical signals beyond just those offered by the CANSLIM methodology, far richer fundamental screening data, but…
… it will cost 70% less. Yes, 70% less.
Stay tuned to this channel.
Thanks for reading CML Pattern Finder.