


Trading a Bear - Pair trading on Charts and Relative Strength

Lede
Today we turn to a discussion of pair trading using a combination of sector immunization, relative strength (RS), trend support/resistance, and finally CANSLIM patterns (like cups and ascending bases).
It reads like a mouthful, but it’s quite fast with Patten Finder.
Step by Step: Pair Trading (Step 1)
We have two steps, both relatively fast, and step number one is a screen.
We looked in the Utilities and Health Technology sectors, with the goal of finding two stocks in each sector — one with weak RS-3 month within its industry paired against one with strong RS in its industry.
RS is measured as a number between 1 and 100, where 1 is a company in the worst percentile of relative stock returns and 100 is a company is the best.
In this case the relativity is based on stocks in the same industry and the period is three-months.
We selected four companies with our screen:
Utilities
EDN (Industry RS-3mo = 96)
TAC (Industry RS-3mo = 5)
Health Tech
CPRX (Industry RS-3mo = 95)
SHC (Industry RS-3mo = 2)
The goal of a pair trade is to minimize market risk (thus a long and a short), avoid industry specific risk (thus pair companies by industry), while speculating on continued behavior: the outperforming stocks continue to show larger returns than the underperforming stocks.
It’s a trade on probabilities, not a silver bullet (there’s no such thing).
Step number two is to look directly at the charts. After all, a RS-3 months is just a summary over that time period, and a trader could feel differently about these stocks after some chart time.
Step by Step: Pair Trading (Step 2)
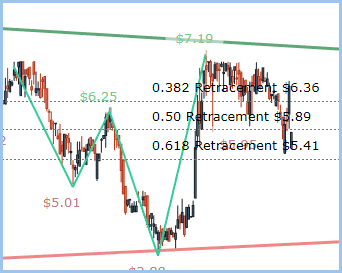
We start with the two companies from the Utilities space, EDN (the strong RS) and then TAC (the weak RS):

Pattern Finder automatically draws in trend support (red line) and trend resistance (green line) as well as the Fibonacci.
Support starts at the end of an ascending base from the COVID lows and passes through another CANSLIM pattern, the bottom of a cup, then through points of congestion in early 2021 and finally through the base of a wobbly double bottom.
The stock is well above support, above the three Fibonacci mid levels, and is below resistance.

This isn’t the most beautiful chart, but it looks better than TAC:

We let Patter Finder do the work for us this time as well with its automatically generated trend lines.
Trend support (red line) passes through the bottom of an ascending base in early 2021 and then through the early 2022 lows.
Trend resistance starts at the 2020 high and passes right through the top of the cup in late 2021.
The stock is through support and below all three of the Fibonacci levels.
As a pair, it is clear where the RS has been strong and weak in the recent (3-month) past.
Now we can turn to our pair of Health Tech stocks.
First, CPRX, the strong RS-3 month stock.

Trend support (red line) starts at the summer lows and connects to the recent trough. Trend resistance starts back in 2019 and connects with the spike earlier this year.
The stock bounced off of support and is right at the .382 Fibonacci line, perhaps even above.

Now we turn to SHC:

The stock has tumbled to support and is nearing the Fibonacci extension. That trend support (red line) starts at the end of a double bottom in 2020 and connects with the low near the end of 2021.

That’s it.
Pair trading can be done many ways, but one of our favorites is through industry immunization, then using short-term RS as a filter, and stock by stock chart analysis as the final piece.
A word for the wise, charting is based on probabilities as is using measures of relative strength.
There are no silver bullets in trading, and we would never imply that there was. Pair trading is done most thoughtfully as a portfolio (and four stocks don’t qualify as a portfolio).
Thanks for reading friends. We hope this was useful.
What’s Next
We will continue to share charts, screens, and short discussions over the next few weeks before the CML Pattern Finder product becomes available in late October.
The product will have everything IBD MarketSmith® has, a lot more, like algorithmically drawn support and resistance trend lines, built with better, faster, more flexible, and more responsive technology.
It allows for additional technical signals beyond just those offered by the CANSLIM methodology, far richer fundamental screening data, but…
… it will cost 70% less. Yes, 70% less.
Stay tuned to this channel.
Thanks for reading CML Pattern Finder.
Sharing really helps and this post is open to everyone for free.
As a former, now retired investment banker for over 20 years and retired CEO of a small hi tech company I can tell you trade machine was working very well a few years ago. Markets have drastically changed and unfortunately a lot of the old models are having a difficult time in this kind of market. As a trader you are constantly dealing with markets that are run by the central bank’s willingness to print money. Those stock & commodities markets are tremendously influenced by central banks printing money and when the money printing press is taken away you are left with an enormous global debt that can’t be paid. It is like a drug addict always needing more and at some point it reaches a very bad breaking point. This is not to dissimilar to 08/-09 mortgage debt crisis. The biggest difference we had back then was individuals pilling up a ton of mortgage debt and the commercial banks willing to keep lending even more money. Now you have whole governments doing the same thing, using their central bankers to do their bidding. The scale of this is exponentially larger and who is going to bail out whole governments EU, CHINA, JAPAN, USA? This will lead to a very unhappy ending in the future (my guess mid 2020’s to no longer than 2030’s). You are beginning to catch small glimpses now , Bank of England, And other very large financial institutions in Europe. Markets are completely manipulated by all these issues and what worked in the past may not work at all. At the end, all I am saying is give Ophir a small break. He does great work, but unfortunately when the global economy changes so drastically it takes time to understand the adjustments you need to make to your models.
You should be ashamed of yourself, Ophir.
CML Pro picks are down the drain, absolute garbage, that you now pivot to a "pattern finding" service, after the disaster that was Trade Machine and CML Pro. Instead of doubling down and finding ways to make your existing service better, you pivot to stealing money from new traders.