


Market Indices and Industry ETFs (Oil, Health Care, Tech, Consumer Staples)

Lede
Today we look at charts more holistically through market indices and some industry ETFs.
S&P 500 - SPX
We last wrote about the S&P 500 on 12-15-2022 with the post S&P 500 - Automatic Adjustment to Support Just Occurred in Real-time; Why it Matters.
That was a fascinating review of algorithmic cues and was our favorite post to date.
In this case, Pattern Finder’s support algorithm for the SPX dropped a day after the FOMC meeting. The takeaway was not advice or a forecast but rather this:
The market move off of the Fed decision and press conference has influenced Pattern Finder to draw SPX support lower -- that's the corollary to an analyst saying they have lowered the bottom range for SPX forecasts (it's all probabilities).
But this is objective, as opposed to an analyst which is highly subjective.
Remember, Pattern Finder (and charting in general) does not make predictions, it handicaps probabilities and today it reads that the probability of SPX going lower are larger than they were yesterday.
With a lower support, whatever the probability of a lower SPX was prior, today the odds of a lower SPX are higher — not a prediction, just a purely algorithmic analysis of odds.
SPX was at 3,899 as of that post, and today it sits at 3,806, down 2.4% in the face of consensus calls for a ‘Santa Clause’ rally.
Now, turn to the chart today, starting with the 10-year chart, using weekly candles.
Pattern Finder automatically draws in trend support (red line), trend resistance (green line), congestion lines (pink), and any CANSLIM patterns, in this case an ascending base.
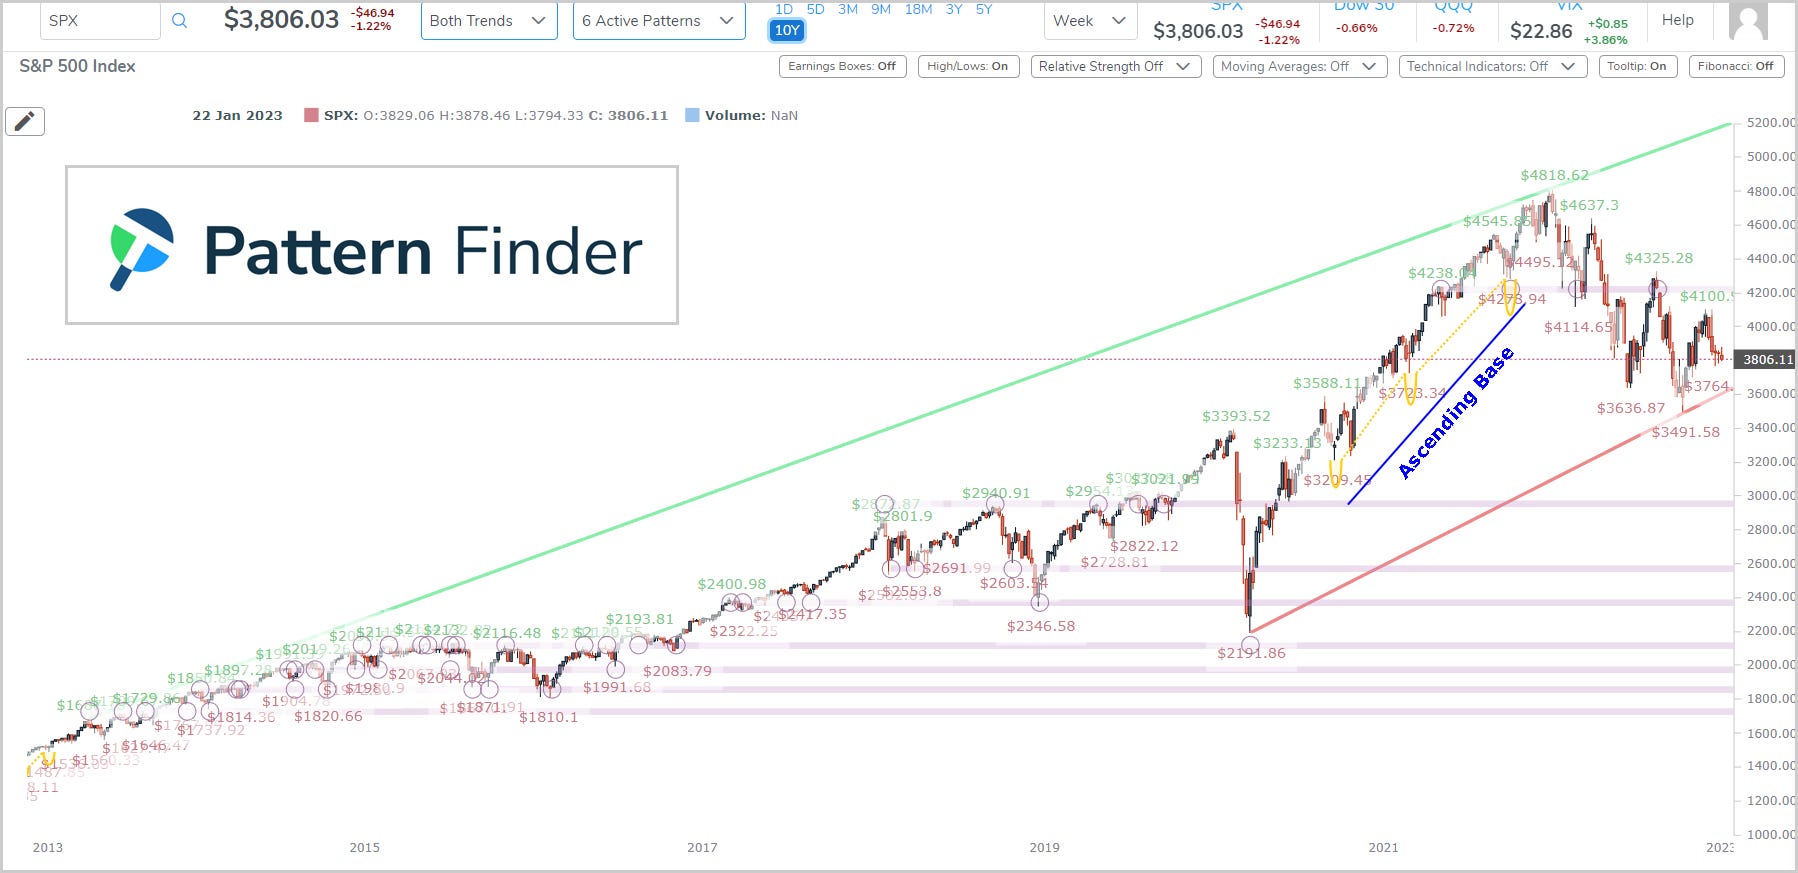
We can zoom in to see some possible levels from afar (10-yeart chart).

We have drawn in lines for the bottom two bases of that ascending base pattern and can see that SPX is right on that first congestion point and has two natural downside supports below it: the next base (~3200) and trending support (~3600).
No one is talking about it, but the natural upside spot would be the top base of that pattern (which is also a congestion line), up to ~4200.
We would hope to see some agreement in the shorter-term to add confidence in those levels and we do have it on the three-year chart:
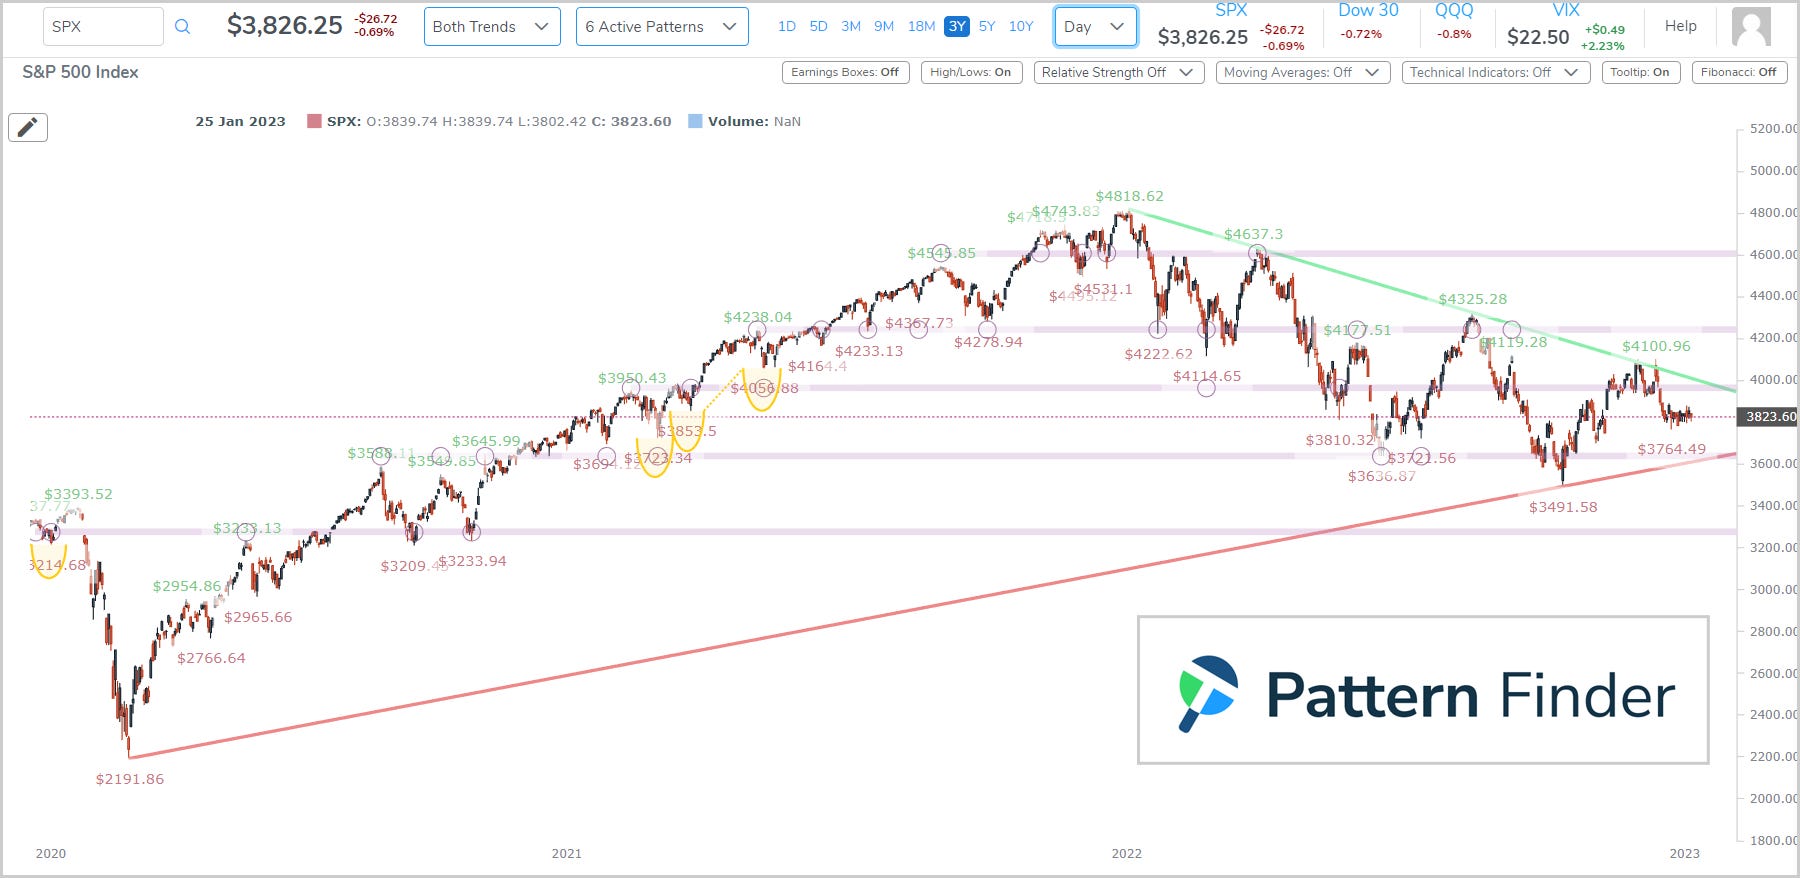
Trend support (red line) is the same as on the decade chart and the congestion lines (pink) are created from the same ascending base. (This is all automatically done by the algorithm, which lives and breathes on its own, in many ways.)
Let’s zoom in and we’ll see the same picture as the 10-year chart.

Roughly speaking there is further to fall to support (from 3823 to 3600) than there is room to rise (from 3823 to ~4000).
We note that the non-farm payrolls (NFP) report and wage inflation are due tomorrow (1-6-2023) and they will quite likely move the market abruptly. For now, there appears to more risk than return in the immediate term (with the caveat of exogenous news due in less than 24 hours).
Now we turn to other sectors.
Other Sectors - Oil & Gas, Health Care, and Technology
We use the VanEck Oil Services ETF (OIH) as a proxy for oil and gas. We note that on 12-27-2022 we penned The Nine Strongest Oil Stocks - Screening and Charting.
Here is the 10-year (weekly candles) OIH chart, to start, and note that the ETF has hit trend resistance (green line) and did so in early November as well.

We can zoom in for clarity:

This looks like an ETF that is exhausted and is on a congestion line that has held four times in the recent past.
A zoom in to the 3-year chart shows some upside to nearest congestion, but it does, in general, mimic the risk:reward profile of the 10-year chart.
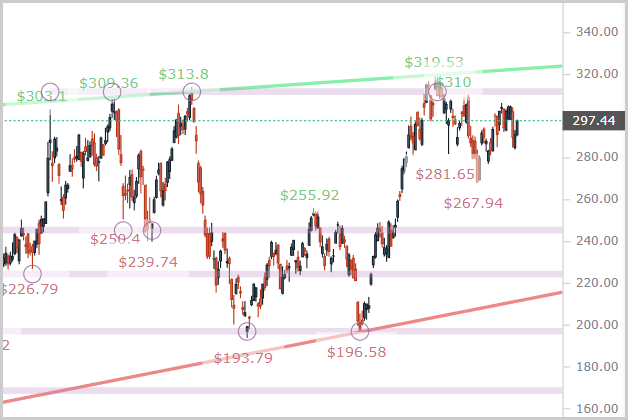
This oil ETF may need a breather, with China and NFP acting as possible shocks to the system in the near-term.
On January 3rd, we penned Strength in Health Care and... China?.
We will use the Health Care Select Sector (XLV) as our proxy, and present the 10-year chart below:
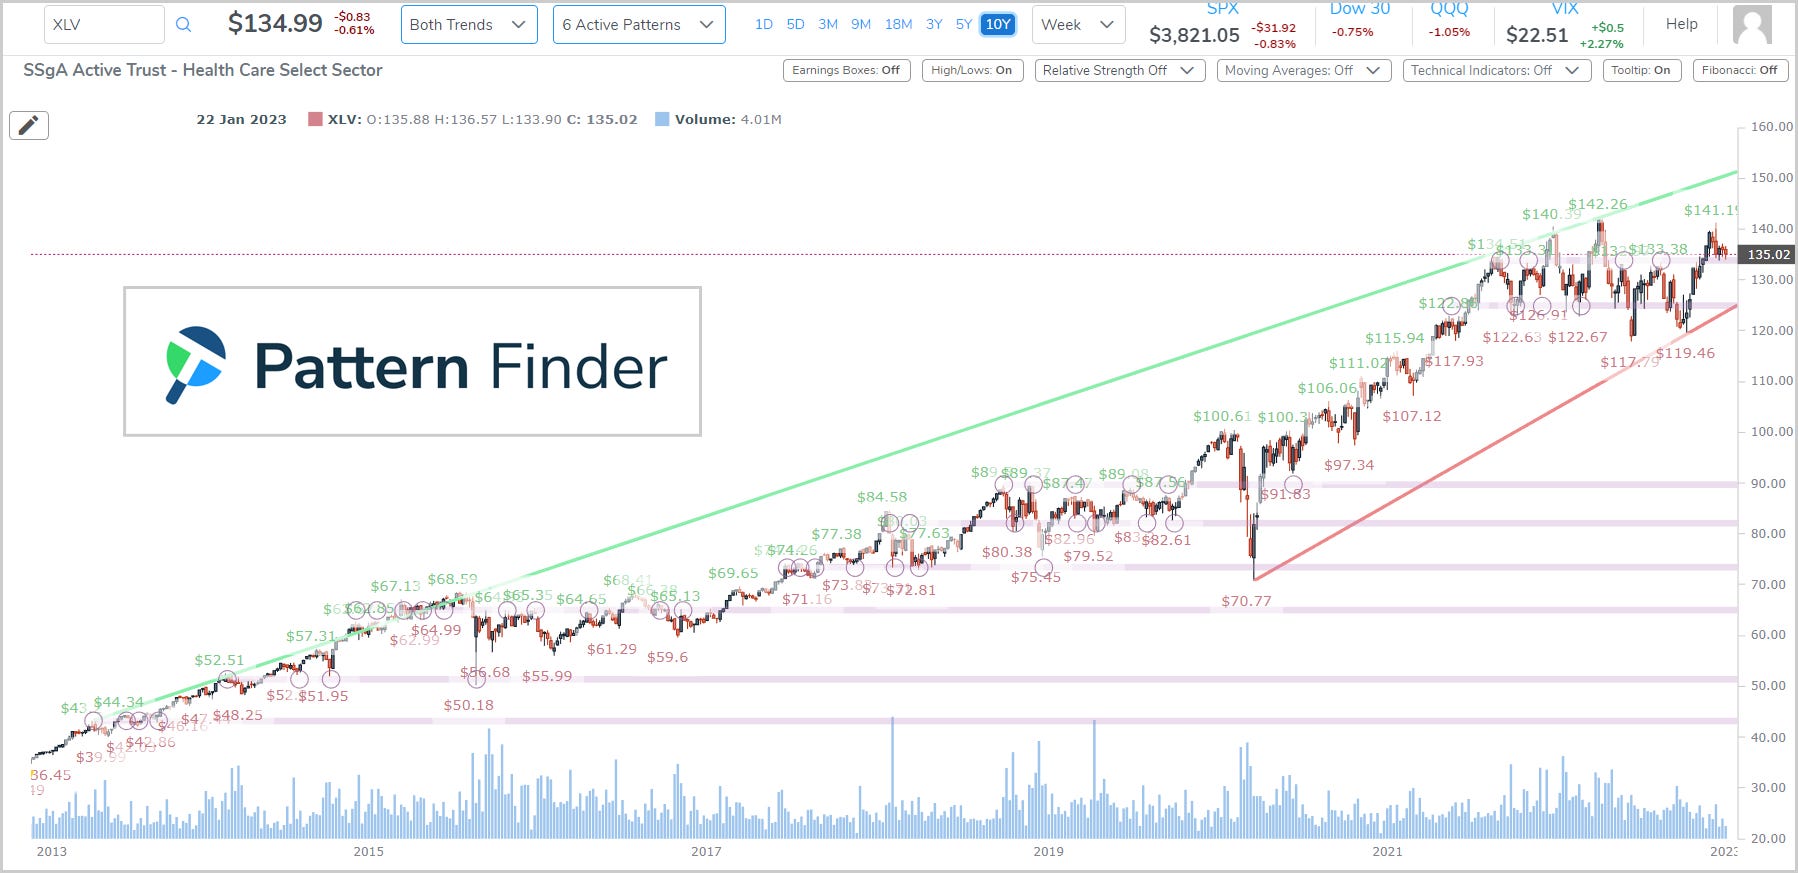
There is a pretty solid upward channel here for a decade now, and it reestablished itself off of the COVID lows.
We zoom in to illustrate the current congestion:

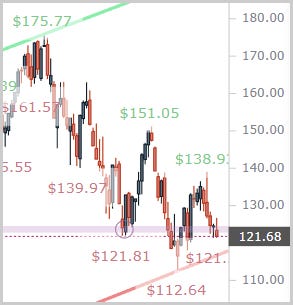
XLV has failed to show a sustained break above that congestion. We need to look to the 9-month chart for more clarity — we zoom in on this chart as well, but this time we use the 9-moth chart with weekly candles to try to get a less spastic day-to-day reading.

On this chart XLV is right on support.
So, we have an ETF at congestion on the long-term chart and at support on the short-term chart.
One reading of this could be that XLV has risk to the ~132 level (congestion line) and upside to the ~141 level (short-term trend resistance), with the caveat that the long-term reads that it will take some volume to push this higher.
And now we move to technology through the XLF ETF. Here is the 10-year chart (weekly candles):

We can zoom in and see lower highs in succession heading toward support, right on congestion.
Welcome to a bear market…
As for other sectors, Pattern Finder members can look at consumer staples through ticker XLP, and see a curling lower price action right off of congestion.
We remind, again, that the non farm payrolls report with wage inflation is due out tomorrow and it will likely move the market. For a daily economic review, you can check out our other Substack Daily Economics.
That’s it for today!
Conclusion
We truly hope you are enjoying using Pattern Finder and our posts and see how easy it is to improve your trading.
Get Pattern Finder and join the trading community, below:
Thanks for reading, friends.